
Journal of Advanced Biological Sciences
ISSN Print: N/A
ISSN Online: 3134-8823
About: Journal of Advanced Biological Sciences (JABS) is a peer-reviewed, open-access journal that aims to publish cutting-edge research and advancements in all areas of biological sciences. The journal serves as a platform for researchers, academicians, and professionals to contribute their scientific knowledge and foster innovation in biology-related fields.
Publisher Responsibility
Lumina Quest Publishing is responsible for providing the journal with the necessary publishing infrastructure, editorial support, production services, digital preservation, and dissemination of published content. The publisher supports transparent and ethical publishing practices and ensures that the journal’s publishing operations are conducted in accordance with applicable scholarly publishing standards.
The publisher is also responsible for maintaining the journal’s website, publication systems, archiving arrangements, and administrative support while respecting the independence of editorial decision-making.
Editorial Responsibility
The Editor-in-Chief and Editorial Board are responsible for maintaining the academic and scientific quality of the journal. The editorial team oversees the evaluation of submitted manuscripts, selection and coordination of peer reviewers, editorial assessment and decisions, and adherence to the journal’s scope and ethical standards.
Editorial decisions are made independently on the basis of academic quality, originality, methodological soundness, relevance, and ethical compliance, without inappropriate influence from the publisher, authors, reviewers, or commercial interests.
Editorial Independence
The editorial team maintains editorial independence in all decisions concerning manuscript evaluation, peer review, acceptance, revision, and rejection. The publisher does not interfere with the academic judgment of editors or reviewers.
Journal of Advanced Biological Sciences | Year 2024 | Volume 1 | Issue 2 | Pages 7-14
Adsorption of Sunset Yellow (E110) Food Dye onto Granular Activated Carbon: Thermodynamic and Kinetic Evaluation
Ibrahim Younus Mohammed 1*, Abeer Qais Younes2 and Abddahah Khaleel Ibrahim31The Chemistry Department, College of Education for Pure Sciences, University of Mosul, Iraq
2,3The Chemistry Department, College of Education for Girls Sciences, University of Mosul, Iraq
View PDF Download XML Download DOI XML DOI: 10.66590/jabs2024010202
Abstract
This study investigated the adsorption behavior of the artificial food dye Sunset Yellow (E110) using granular activated carbon as an adsorbent material. Sunset Yellow is a complex, high-molecular weight chemical compound containing several active functional groups. The adsorption characteristics of the dye were evaluated through spectrophotometric analysis using UV-Visible spectroscopy to establish a standard calibration curve and determine the remaining dye concentration after adsorption. Adsorption capacity and removal efficiency were subsequently calculated. Several factors affecting the adsorption process were examined, including the initial dye concentration, temperature range (298-318 K), adsorbent dosage, contact time and solvent type. Thermodynamic parameters of the adsorption process were determined using equilibrium constant values and the Van’t Hoff equation. The calculated positive values of enthalpy change (ΔH°) and distribution coefficient (Kd) indicated that the adsorption process was endothermic in nature. Since the ΔH° values did not exceed 40 kJ/mol, the adsorption was identified as predominantly physical adsorption. The negative Gibbs free energy (ΔG°) values obtained from equilibrium constant calculations demonstrated that the adsorption process was spontaneous at lower temperatures, with spontaneity increasing as temperature increased while maintaining a constant initial dye concentration. However, increasing the initial dye concentration at constant temperature reduced the spontaneity of adsorption. In contrast, calculations based on Kd values produced positive ΔG° values, indicating non-spontaneous adsorption behavior under those conditions. Positive entropy values (ΔS and ΔS°) suggested increased molecular organization of dye molecules at equilibrium during the adsorption process. The sticking probability (S*) was calculated using the modified Arrhenius equation and the obtained values fell within the preferred adsorption range (0<S*<1), confirming the predominance of physical adsorption on the adsorbent surface. Furthermore, the apparent activation energy values indicated that the adsorption process was diffusion-controlled and favored lower temperatures within the experimental range investigated in this study.
INTRODUCTION
Sunset Yellow (E110) is a yellow azo dye synthesized from coal tar and possesses the following characteristics: it belongs to the monoazo dye group and exists in the form of reddish-orange solid granules. It is considered one of the harmful synthetic dyes because it is widely used in many food industries and carbonated beverages, which has led researchers to investigate the use of inexpensive and naturally available materials for its removal through adsorption [1].
The attractive force between the liquid substance adsorbed onto the surface of a solid material and the energy required to return that substance back into the solution is measured by the heat of adsorption (enthalpy, ΔH). This parameter helps determine the nature of the adsorption process, whether it is physical or chemical adsorption [2]. The heat of adsorption can be calculated using the Van’t Hoff equation, as shown in Equation 1:
lnKc = lnKo - ∆HRT
(1)
Where:
- ΔH represents the heat of adsorption (enthalpy)
- Kc represents the adsorption equilibrium constant
- K₀ represents a constant value
- T represents the absolute temperature
- R represents the universal gas constant (8.314 J/mol·K)
Plotting the relationship between ln(Kc) and (1/T) produces a linear relationship with a straight-line slope equal to (-ΔH/R). From this relationship, the value of the heat of adsorption can be calculated. The adsorption equilibrium constant (Kc) can be determined by dividing the concentration of the adsorbed substance (Cads) by the remaining equilibrium concentration (Ce) of the non-adsorbed substance, as shown in the following equation [3]:
Kc = Cads.Ce
(2)
Cads.= Ci–Ce
(3)
Where:
- Cads represents the concentration of the adsorbed substance (mg/L)
- Ce represents the concentration of the non-adsorbed substance at equilibrium (mg/L)
- Ci represents the initial concentration of the adsorbate (mg/L)
The values of the thermodynamic functions can be calculated using the following equations:
∆G°= -RT lnKc
(4)
∆G° = ∆H- T∆S°
(5)
∆S° = (∆H-∆G°)T
(6)
∆S = ∆H/T
(7)
The study of the distribution coefficient (Kd), the sticking probability of adsorbate ions on the adsorbent surface (S*) and the apparent activation energy (Ea) is important for identifying the nature of the adsorption process, whether it is physical adsorption, chemical adsorption or a combination of both. This can be determined through thermodynamic analysis of the adsorption process using the modified Arrhenius equation [4].
S* = (1 -θ) exp - Ea-/RT
(8)
θ = 1- CeCi
(9)
ln (1-θ) = ln S*-Ea-/RT
(10)
Plotting the relationship between ln(1-θ) and 1/T gives a linear relationship in which the intercept represents ln(S*) and the slope represents (-Ea/R). The sticking probability (S*) is defined as the rate of adsorption for each molecular collision with the surface [5].
When the value of S* is greater than 1 (S*>1), this indicates that the ions do not adhere to the solid surface. If S* = 0, adsorption tends toward infinity on the surface, indicating chemical adsorption. When S* = 1, the adsorption process represents a combination of physical and chemical adsorption. However, when 0<S*<1, adsorption is considered favorable, indicating preferred adhesion of the adsorbate onto the adsorbent surface, with physical adsorption being the dominant mechanism [6-9].
Experimental Section
The practical aspect plays a fundamental role in all applied sciences because of its accuracy, reliability and importance in obtaining precise results, as well as in the preparation of chemical materials and the use of laboratory equipment. Therefore, this study focused extensively on the experimental procedures, which can be explained through the following sections:
Chemicals and Materials
The primary chemicals and solvents used in this study were obtained from BDH Chemicals and Fluka Chemicals. The materials used included:
- Activated Carbon (Granular): Granular activated carbon was used in the form of solid granules. The material was heated in an electric oven at 100°C for 3 hours and then stored in a dry, tightly sealed container
- Hydrochloric Acid (HCl)
- Sodium Hydroxide (NaOH)
- Absolute Ethanol
- Distilled Water
- Sunset Yellow Food Dye (E110)
The synthetic food dye Sunset Yellow was purchased from markets in Mosul in tightly sealed bottles manufactured by internationally recognized companies, including Ajanta Chemical Industries, India (Table 1).
Table 1: Chemical Name, Molecular Formula and Selected Physical Properties of Food Dye E110
|
Property |
Description |
|
Dye Symbol |
E110 |
|
Chemical Family |
Monoazo |
|
Common Name |
Sunset Yellow |
|
Scientific Name |
Disodium; 6-hydroxy-5-[(4-sulfonato phenyl)diazenyl] naphthalene-2-sulfonate |
|
Chemical Formula |
C16H10N2O7S2Na2 |
|
Molecular Weight |
452.37 g/mol |
|
pH Range |
8-Jun |
|
Melting Point |
300 °C |
|
Λmax |
480 nm |
|
Molar Absorptivity (ε) |
19707 L/mol·cm |
|
Optimum Adsorption Conditions |
Ci = 45.237 g/L, Temp. = 45°C, pH = 8.11 |
Laboratory Instruments Used
Electrothermal Melting Point Apparatus-9300: Used for measuring the melting point of the dye.
pH Meter-JENWAY 3510
The instrument was calibrated using standard buffer solutions (pH 7 and pH 9). The acidity function (pH) of the synthetic food dye solution was measured at the optimum temperature before the adsorption process.
Shaker with Water Bath-Julabo SW 23
Used to control and maintain the temperature during the adsorption process.
Drying Oven-Memmert
Used for drying the food dye material under investigation.
T92+UV Spectrophotometric PG Instruments
Used for measuring ultraviolet and visible spectral absorption in order to determine the λmax values of the synthetic food dye.
CECIL Spectrophotometric 1000S
Used for measuring the absorption spectra of the dye using distilled water as solvent and blank solution with 1 cm optical cells.
Preparation of Solutions
- A 1.0 M sodium hydroxide (NaOH) solution was prepared by dissolving 0.4 g of NaOH in 100 mL of distilled water
- A 0.1 M hydrochloric acid (HCl) solution was prepared by dilution of concentrated HCl (11.63 M) according to the dilution law to obtain 100 mL of solution
- A standard solution of Sunset Yellow dye (E110) was prepared by dissolving 1 g of the dye in one liter of distilled water. Additional lower concentrations within the range of approximately (2×10⁻⁵ M to 10×10⁻⁵ M) were prepared using the dilution law
The change in the amount of adsorbed dye with time was monitored using Lambert-Beer’s law to construct a calibration curve at λmax by plotting absorbance versus concentration in order to determine the molar absorptivity coefficient from the slope of the relationship according to the following equation:
A = ε0000LCA = \varepsilon L CA=εLC
εεε
ccc
lll
Where:
- A represents the absorbance of the synthetic food dye at various concentrations
- ε represents the molar absorptivity coefficient (L/mol·cm)
- C represents the concentration of the synthetic food dye (M)
- L represents the optical path length of the absorption cell (1 cm)
Maximum Wavelength and Calibration Curve of E110 Dye
The maximum wavelength (λmax) of the synthetic food dye was determined by recording the absorption spectrum of the dye solution at constant concentration using the T92+ UV Spectrophotometric PG Instruments device. The maximum wavelength was identified at the highest absorbance value.
For a proper adsorption study, it is essential to use an appropriate analytical method to determine the remaining concentration of the adsorbate after adsorption onto the adsorbent surface. Since the adsorbate in this study was a colored compound, the spectrophotometric method in the ultraviolet-visible region (200-800 nm) was considered the most suitable analytical technique.
The concentration of the synthetic food dye before and after adsorption was determined using the CECIL Spectrophotometric 1000S UV-Visible spectrophotometer. The obtained results were expressed in mg/L using the previously prepared standard calibration curve.
The amount of adsorbed dye was expressed in terms of adsorption capacity (qe) and adsorption efficiency (%) through estimation of the remaining concentration (Ce) and adsorbed amount (Cads), according to the following equations.
RESULTS AND DISCUSSION
This study investigated the potential effects of synthetic food dyes on human health through the application of chemical principles [10]. Numerous previous studies and scientific reports [11,12] have demonstrated considerable interest in developing effective methods for reducing or eliminating the harmful effects of synthetic food dyes on both human health and the environment. Understanding the behavior and impact of these synthetic dyes requires extensive and detailed investigations by researchers.
Determination of the Calibration Curve of Food Dye E110
The calibration curve of the synthetic food dye E110 was determined at its maximum wavelength (λmax), as illustrated in Figure 1, by preparing dye solutions of different concentrations and measuring their absorbance values. The relationship between absorbance intensity and molar concentration of the food dye was then plotted. The resulting relationship was expected to follow Lambert-Beer’s law according to Equation (11).
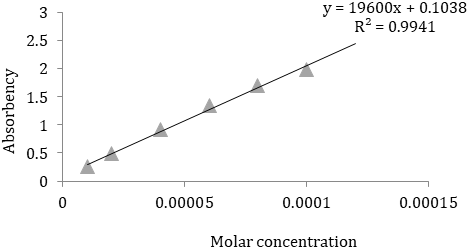
Figure 1: Calibration Curve of the Synthetic Food Dye E110
From the calibration curve, straight-line relationships were observed over well-defined concentration ranges with correlation coefficient (R²) values close to unity. In addition, the molar absorptivity coefficient values were satisfactory, indicating that this spectrophotometric method can be reliably used for determining the concentration of the synthetic food dye investigated in this study.
Since the primary objective of this research was to conduct a thermodynamic study of the adsorption process, it was necessary to determine suitable concentrations of the synthetic food dye solutions and the appropriate amount of adsorbent material (granular activated carbon) until adsorption equilibrium was achieved. This allowed evaluation of the influence of various factors on the adsorption process.
Study of the Influencing Factors
Effect of Adsorbent Weight: It was observed that increasing the weight of the adsorbent material resulted in an increase in adsorption efficiency (%) and a decrease in adsorption capacity (qe). This behavior can be attributed to the increase in the number of available active sites for adsorption on the adsorbent surface, which enhanced the adsorption of food dye molecules. Consequently, the percentage of adsorption increased, while the ratio of milligrams of adsorbed material to milligrams of adsorbent decreased, as shown in the Table 2.
Table 2: Effect of Adsorbent Weight on the Adsorption Efficiency and Adsorption Capacity of Synthetic Food Dye E110 at Natural pH
|
Percentage |
qe mg/gm |
Ce mg/L |
gm |
|
34.9979 |
15.832 |
5.881 |
0.01 |
|
49.39541 |
4.469 |
4.5784 |
0.05 |
|
56.21947 |
3.633143 |
3.961 |
0.07 |
|
64.89599 |
2.9357 |
3.176 |
0.1 |
|
80.06057 |
0.72434 |
1.804 |
0.5 |
.
For the present study, an adsorbent amount of 0.5 g was selected because it provided an appropriate level of dye removal while still retaining a measurable portion of the dye in solution, thereby satisfying the requirements of the study and enabling accurate thermodynamic calculations.
Effect of Contact Time
To determine the type, nature and behavior of the adsorption system and to evaluate the adsorption ability of the dye molecules from solution onto the solid adsorbent surface, the effect of contact time between the synthetic food dye molecules and the surface of granular activated carbon was investigated. This factor plays a significant role in the adsorption process.
The study was conducted by determining the adsorption rate and identifying the optimum contact time required for maintaining the adsorbent material in contact with the dye solution until equilibrium was reached, while all other experimental parameters were kept constant. The obtained results are presented in the Table 3.
Table 3: Effect of Contact Time on the Adsorption Efficiency and Adsorption Capacity of Synthetic Food Dye E110 on 0.5 g of Granular Activated Carbon at Natural pH
|
Percentage |
qe mg/gm |
Ce mg/L |
t min. |
|
64.02785 |
0.57926 |
3.2544 |
5 |
|
72.25931 |
0.65373 |
2.5097 |
15 |
|
77.46325 |
0.70081 |
2.0389 |
25 |
|
80.06411 |
0.72434 |
1.8036 |
35 |
|
84.82923 |
0.76745 |
1.3725 |
45 |
|
86.99901 |
0.78708 |
1.1762 |
60 |
|
88.73218 |
0.80276 |
1.0194 |
70 |
|
88.73218 |
0.80276 |
1.0194 |
80 |
.
Since the adsorption rate reaches its maximum during the initial minutes of the adsorption process, it was observed that the highest amount of synthetic food dye was transferred onto the surface of granular activated carbon at approximately 70 minutes. After this period, the adsorption percentage gradually became constant until equilibrium was achieved.
This behavior can be explained by the fact that, at the beginning of contact between the synthetic food dye molecules and the adsorbent surface, a large number of active adsorption sites are available, allowing rapid diffusion and adsorption of dye molecules during the early stages of contact. As time progresses, the number of available active sites decreases, resulting in competition among the remaining non-adsorbed dye molecules as well as interactions with the already adsorbed molecules. Consequently, repulsive forces increase between the molecules, causing some adsorbed molecules to return to the solution until adsorption equilibrium is reached, where the number of adsorbed molecules equals the number of desorbed molecules.
Effect of Solvent on Adsorption
An appropriate organic solvent, ethanol, was selected and mixed with water in order to investigate the effect of solvent composition on the adsorption process. The adsorption efficiency and adsorption capacity of the synthetic food dye on the adsorbent surface were studied using ethanol-water solvent mixtures with ethanol volume percentages ranging from 10% to 90% under optimum experimental conditions, as shown in the Table 4.
Table 4: Effect of Solvent Composition on the Adsorption Efficiency and Adsorption Capacity of Synthetic Food Dye on 0.5 g of Granular Activated Carbon at Natural pH and Optimum Temperature
|
% |
qe mg/gm |
Ce mg/L |
ايثانول : ماء |
|
63.16179 |
0.57145 |
3.3329 |
90-10 |
|
67.49563 |
0.61066 |
2.9408 |
80-20 |
|
69.67084 |
0.63034 |
2.744 |
60-40 |
|
73.99695 |
0.66948 |
2.3526 |
40-60 |
|
95.23288 |
0.86161 |
0.4313 |
20-80 |
.
From Table 4, it was observed that the adsorption efficiency and adsorption capacity of dye E110 increased with increasing ethanol content, corresponding to a decrease in the dielectric constant of the solvent mixture. It is well known that water possesses a higher dielectric constant (approximately 80) compared to ethanol (approximately 65). Therefore, mixing water with ethanol produces solvent systems with dielectric constants lower than that of pure water.
An increase in the dielectric constant of the solvent enhances the tendency of dissolved dye molecules to migrate toward the adsorbent surface rather than participating in solute-solute and solvent-solute molecular interactions. Consequently, the adsorption efficiency increases with increasing dielectric constant of the solvent system [13].
Effect of Initial Dye Concentration
The effect of five different initial concentrations of the food dye was investigated within the range of (2-10)×10⁻⁵ M over the temperature range used in this study while keeping all other experimental variables constant. A fixed volume of the food dye solution was shaken at a constant speed of 100 rpm using the same amount of adsorbent material for 70 minutes. After filtration, the remaining concentration of the dye in the solution was determined spectrophotometrically following the adsorption process. The obtained results are presented in the Table 5.
Table 5: Effect of Initial Concentration on the Adsorption of Synthetic Food Dye E110 onto Granular Activated Carbon
|
% |
qe mg/gm |
Cads. mg/L |
Ci mg/L |
T k⸰ |
|
82.62153 |
0.74751 |
7.4751 |
9.0474 |
298 |
|
81.2498 |
1.4702 |
14.702 |
18.0948 |
|
|
80.93301 |
2.1967 |
21.967 |
27.1422 |
|
|
78.22026 |
2.83076 |
28.3076 |
36.1896 |
|
|
73.76108 |
3.33673 |
33.3673 |
45.237 |
|
|
86.05456 |
0.77857 |
7.7857 |
9.0474 |
303 |
|
82.60384 |
1.4947 |
14.947 |
18.0948 |
|
|
81.21007 |
2.20422 |
22.0422 |
27.1422 |
|
|
80.09097 |
2.89846 |
28.9846 |
36.1896 |
|
|
75.43781 |
3.41258 |
34.1258 |
45.237 |
|
|
86.85589 |
0.78582 |
7.8582 |
9.0474 |
308 |
|
83.79977 |
1.51634 |
15.1634 |
18.0948 |
|
|
81.57813 |
2.21421 |
22.1421 |
27.1422 |
|
|
80.30815 |
2.90632 |
29.0632 |
36.1896 |
|
|
75.92922 |
3.43481 |
34.3481 |
45.237 |
|
|
86.99958 |
0.78712 |
7.8712 |
9.0474 |
313 |
|
84.99845 |
1.53803 |
15.3803 |
18.0948 |
|
|
83.0968 |
2.25543 |
22.5543 |
27.1422 |
|
|
80.86273 |
2.92639 |
29.2639 |
36.1896 |
|
|
76.74094 |
3.47153 |
34.7153 |
45.237 |
|
|
87.67049 |
0.79319 |
7.9319 |
9.0474 |
318 |
|
86.49059 |
1.56503 |
15.6503 |
18.0948 |
|
|
85.17254 |
2.31177 |
23.1177 |
27.1422 |
|
|
83.42314 |
3.01905 |
30.1905 |
36.1896 |
|
|
79.56186 |
3.59914 |
35.9914 |
45.237 |
.
From Table 5, it was observed that increasing the initial concentration of the synthetic food dye at constant temperature resulted in a decrease in both adsorption capacity and adsorption efficiency. This behavior can be explained by the fact that increasing dye concentration increases the number of dye molecules available for adsorption while the number of active adsorption sites on the surface of granular activated carbon remains constant.
As the number of dye molecules increases, repulsive interactions among the molecules become stronger due to competition for the available active sites on the adsorbent surface. Furthermore, increasing concentration enhances molecular interactions between dye molecules as well as interactions between the dye and the solvent because the molecules become closer to each other, leading to the formation of intermolecular hydrogen bonds and Van der Waals forces. In addition, a large number of dye molecules remain in solution after equilibrium is reached, resulting in lower adsorption capacity and adsorption efficiency.
The ionization process of the synthetic food dye also decreases with increasing concentration, thereby reducing the number of ions transferred to the solid surface, which consequently decreases adsorption efficiency and adsorption capacity [14].
It was also observed that the adsorption percentage reached its highest value at the lowest dye concentration (2×10⁻⁵ M) and gradually decreased with increasing concentration. This indicates that adsorption is more efficient in dilute dye solutions. At higher concentrations, the number of dye molecules transferred to the adsorbent surface increases, leading to stronger competition among molecules for active adsorption sites. As a result, repulsive forces increase and some molecules return to the solution, causing a reduction in adsorption efficiency [15-17].
Effect of Temperature
The effect of temperature on the adsorption efficiency of the investigated synthetic food dye onto the adsorbent surface was studied while keeping all other experimental conditions constant. The obtained results are presented in the Table 6.
Table 6: Remaining Concentration, Adsorption Capacity and Adsorption Efficiency of the Investigated Synthetic Food Dye Using Granular Activated Carbon as an Adsorbent at Different Temperatures and Optimum Dye Concentration under Natural pH Conditions
|
% |
Kc |
qe mg/gm |
Ce mg/L |
T k⸰ |
Ci mg/L |
|
82.62153 |
4.754245 |
0.74751 |
1.5723 |
298 |
9.0474 |
|
86.05456 |
6.170801 |
0.77857 |
1.2617 |
303 |
|
|
86.85589 |
6.607972 |
0.78582 |
1.1892 |
308 |
|
|
86.99958 |
6.692059 |
0.78712 |
1.1762 |
313 |
|
|
87.67049 |
7.110623 |
0.79319 |
1.1155 |
318 |
|
|
81.2498 |
4.3329 |
1.4702 |
3.3928 |
298 |
18.0948 |
|
82.60384 |
4.748396 |
1.4947 |
3.1478 |
303 |
|
|
83.79977 |
5.17275 |
1.51634 |
2.9314 |
308 |
|
|
84.99845 |
5.665979 |
1.53803 |
2.7145 |
313 |
|
|
86.49059 |
6.40225 |
1.56503 |
2.4445 |
318 |
|
|
80.93301 |
4.244667 |
2.1967 |
5.1752 |
298 |
27.1422 |
|
81.21007 |
4.322 |
2.20422 |
5.1 |
303 |
|
|
81.57813 |
4.428331 |
2.21421 |
5.0001 |
308 |
|
|
83.0968 |
4.91604 |
2.25543 |
4.5879 |
313 |
|
|
85.17254 |
5.744242 |
2.31177 |
4.0245 |
318 |
|
|
78.22026 |
3.591423 |
2.83076 |
7.882 |
298 |
36.1896 |
|
80.09097 |
4.022845 |
2.89846 |
7.205 |
303 |
|
|
80.30815 |
4.078244 |
2.90632 |
7.1264 |
308 |
|
|
80.86273 |
4.225407 |
2.92639 |
6.9257 |
313 |
|
|
83.42314 |
5.032505 |
3.01905 |
5.9991 |
318 |
|
|
73.76108 |
2.811133 |
3.33673 |
11.8697 |
298 |
45.237 |
|
75.43781 |
3.071297 |
3.41258 |
11.1112 |
303 |
|
|
75.92922 |
3.154414 |
3.43481 |
10.8889 |
308 |
|
|
76.74094 |
3.2994 |
3.47153 |
10.5217 |
313 |
|
|
79.56186 |
3.892814 |
3.59914 |
9.2456 |
318 |
.
It was observed that the adsorption capacity and adsorption efficiency increased with increasing temperature at constant dye concentration, indicating that temperature acts as a positive factor in the adsorption process on the solid surface [18,19]. This behavior can be attributed to the increase in the kinetic energy of dye molecules with increasing temperature, which facilitates their transfer from the solution phase to the solid adsorbent surface.
This effect is particularly important in the thermodynamic study of adsorption enthalpy and contributes significantly to enhanced adsorption when the interactions between the adsorbed molecules and the adsorbent surface are not purely physical or are associated with relatively strong physical interactions.
The equilibrium constant (Kc) values also increased with increasing temperature at constant concentration, confirming the enhancement of adsorption efficiency of the synthetic food dye onto the adsorbent surface. This indicates that the adsorption system is endothermic in nature. Increasing temperature enhances the interaction between dye molecules and the adsorbent surface and promotes the sorption process, thereby increasing the adsorption equilibrium constant.
On the other hand, increasing the concentration of the synthetic food dye at constant temperature resulted in a decrease in the equilibrium constant values and consequently reduced adsorption efficiency. This behavior is attributed to the increased molecular interactions among dye molecules, which possess relatively large molecular structures. As dye concentration increases, the molecules become closer to each other, resulting in reduced molecular mobility and lower energy absorption by the adsorption system [20].
From the values presented in Table 10, the following observations were made:
- The sticking probability values (S*) of the food dye on the surface of granular activated carbon were greater than zero and less than one, which represents the preferred range according to the modified Arrhenius equation (Equation 8) [6]. The obtained S* values were very close to zero and far from unity. These values indicate that the adsorption of the synthetic food dye remained within the preferred range (0<S*<1), confirming the predominance of physical adsorption. However, in dilute solutions, the values approached the region associated with chemical adsorption behavior. As the dye concentration increased, the S* values also increased, indicating a return toward complete dominance of physical adsorption.
- The S* values increased with increasing dye concentration and remained within the preferred range for physical adsorption. Values very close to zero indicate strong adhesion of the synthetic food dye molecules onto the surface of granular activated carbon, confirming the occurrence of physical sorption of dye molecules. On the other hand, values approaching but remaining below unity suggest lower physical penetration of the dye molecules into the internal pores of the adsorbent material
- In both dilute and concentrated solutions, the apparent activation energy (AAE) values for adsorption of the synthetic food dye onto granular activated carbon were negative. The magnitude of the negative values decreased with increasing concentration. This indicates that lower temperatures are more favorable for dye removal in dilute solutions, whereas higher concentrations favor relatively higher temperatures for adsorption. This behavior can be attributed to the weaker intermolecular interactions in dilute solutions, where dye molecules remain farther apart compared with concentrated solutions. In addition, greater diffusion of dye molecules into the internal pores of granular activated carbon occurs in dilute solutions. When the S* values are extremely close to zero, spontaneous physical adsorption (physisorption) also becomes more favorabl
The low apparent activation energy values further indicate that the adsorption of the synthetic food dye onto granular activated carbon is primarily a diffusion-controlled process. Furthermore, the same trend confirms a decrease in physical sorption with increasing dye concentration in solution [31,32].
REFERENCES
- Abdel-Aziz, H.M. and S.A. Abdel-Gawad. “Removal of Sunset Yellow Azo Dye Using Activated Carbon Entrapped in Alginate from Aqueous Solutions.” Open Access Journal of Science, vol. 4, no. 1, 2020, pp. 1-6.
- Kent, S.K. Adsorbent Selection. Adsorption Research, Inc., 2003, pp. 1-33.
- Khaleel, I. and G. Ahmed. “Isothermic Adsorption and Application of Kinetics Models, Thermodynamics Functions, Probability Sticking for Benzoic Acid and Some Substituted by Using a New Adsorbent Substance.” Journal of College of Education for Pure Science, University of Mosul, vol. 28, no. 2, 2019, pp. 23-29.
- Horsfall, M.H.J. et al. “Electronic Journal of Biotechnology.” Electronic Journal of Biotechnology, vol. 8, no. 2, 2005, pp. 162-169.
- Jung, L.S. and C.T. Campbell. “Sticking Probabilities in Adsorption from Liquid Solutions: Alkylthiols on Gold.” Physical Review Letters, vol. 84, no. 22, 2000.
- Horsfall Jnr, M. and A.I. Spiff. “Effects of Temperature on the Sorption of Pb2+ and Cd2+ from Aqueous Solution by Caladium bicolor (Wild Cocoyam) Biomass.” Electronic Journal of Biotechnology, vol. 8, no. 2, 2005, pp. 43-50.
- Saleh, T.A. “Adsorption Technology and Surface Science.” Interface Science and Technology, vol. 34, Elsevier, 2022, pp. 39-64.
- Saleh, T.A. “Isotherm Models of Adsorption Processes on Adsorbents and Nanoadsorbents.” Interface Science and Technology, vol. 34, Elsevier, 2022, pp. 99-126.
- Saleh, T.A. “Kinetic Models and Thermodynamics of Adsorption Processes: Classification.” Interface Science and Technology, vol. 34, Elsevier, 2022, pp. 65-97.
- Khatri, A. et al. “A Review on Developments in Dyeing Cotton Fabrics with Reactive Dyes for Reducing Effluent Pollution.” Journal of Cleaner Production, vol. 87, 2015, pp. 50-57.
- Adamu, A. Adsorptive Removal of Reactive Azo Dyes Using Industrial Residue. Addis Ababa University, 2008.
- AL-Hyali, E.A. et al. “A Thermodynamic and Kinetic Study for Adsorption of a Number of Dyes from Their Aqueous Solutions on a New Kind of Activated Carbon Prepared by Pomegranate (Punica granatum) Peels via Chemical Treatment.”
- Atkins, P.W. Physical Chemistry. 4th ed., Oxford University Press, 1996.
- Pimental, G.C. and A.L. Mecellellan. The Hydrogen Bond. Freeman, 1960.
- Ho, Y.S. and G. McKay. “Application of Kinetic Models to the Sorption of Copper II on Peat.” Adsorption Science & Technology, vol. 20, no. 8, 2002.
- Yakout, S.M. and E. Elsheriff. “Batch Kinetics, Isotherm and Thermodynamic Studies of Adsorption of Strontium from Aqueous Solution onto Low Cost Rice-Straw Based Carbon.” Carbon Science and Technology, vol. 1, 2010, pp. 144-153.
- Bruch, L.W. et al. Physical Adsorption: Forces and Phenomena. Courier Dover Publications, 2007.
- Mondal, N.K. and S. Chakraborty. “Adsorption of Cr(VI) from Aqueous Solution on Graphene Oxide (GO) Prepared from Graphite: Equilibrium, Kinetic and Thermodynamic Studies.” Applied Water Science, vol. 10, 2020, pp. 1-10.
- Fatima, A. et al. “Adsorption, Modeling, Thermodynamic and Kinetic Studies of Acteray Golden Removal from Polluted Water Using Sindh Clay and Quartz as Low-Cost Adsorbents.” Separations, vol. 10, no. 10, 2023.
- Yao, Z.Y. et al. “Equilibrium, Kinetic and Thermodynamic Studies on the Biosorption of Cu(II) onto Chestnut Shell.” Journal of Hazardous Materials, vol. 174, no. 1-3, 2010, pp. 137-143.
- Khenifi, A. et al. “Adsorption Study of an Industrial Dye by an Organic Clay.” Adsorption, vol. 13, no. 2, 2007, pp. 149-158.
- Chowdhury, S. et al. “Adsorption Thermodynamics, Kinetics and Isosteric Heat of Adsorption of Malachite Green onto Chemically Modified Rice Husk.” Desalination, vol. 265, no. 1-3, 2011, pp. 159-168.
- Horsfall, M.H.J. and A. Ayebaemi. “Electronic Journal of Biotechnology.” Electronic Journal of Biotechnology, vol. 8, no. 2, 2003, pp. 162-169.
- AL-Niemi, K.I. “Mechanism, Kinetic and Thermodynamic for Transport of Citric Acid Ions to Removal by Adsorption Using Electrical Conductivity, Potential Difference and Acidity Function.” Journal of Education and Science, vol. 28, no. 2, 2019, pp. 85-102.
- Kılıç, M. and A.S.K. Janabi. “Investigation of Dyes Adsorption with Activated Carbon Obtained from Cordia myxa.” Bilge International Journal of Science and Technology Research, vol. 1, no. 2, 2017, pp. 87-104.
- Sivashankar, R. et al. “Biosorption of Hazardous Azo Dye Metanil Yellow Using Immobilized Aquatic Weed.” Proceedings of International Conference on Future Trends in Structural, Civil, Environmental and Mechanical Engineering, July 2013, pp. 978-981. https://doi.org/10. 15242/IICBE.C0713508.
- Do, D.D. Adsorption Analysis: Equilibria and Kinetics. Vol. 2, World Scientific, 1998.
- Iftekhar, S. et al. “Understanding the Factors Affecting the Adsorption of Lanthanum Using Different Adsorbents: A Critical Review.” Chemosphere, vol. 204, 2018, pp. 413-430.
- Khaleel, I. AL-Niemi. “Journal of University of Anbar for Pure Science.” Journal of University of Anbar for Pure Science, vol. 9, no. 2, 2015.
- Okorocha, N.J. et al. “Adsorptive Removal of Crystal Violet Using Agricultural Waste: Equilibrium, Kinetic and Thermodynamic Studies.” American Journal of Engineering Research, vol. 8, 2019.
- Alniemi, K.I. “Calculation Values of Potential Stickiness (S*) and Apparent Activation Energy (AAE) from Adsorption of Some Aromatic Carboxylic Acids on the Surface of a New Adsorbent Substance.” Journal of Education and Science, vol. 29, no. 4, 2020, pp. 76-89.
- Al-Niemi, K.I. “Application of Kinetic Model of Adsorption for Elovich and the Intraparticles Diffusion, the Sticking Probability (S*), Tempkin Isotherm on Some Different Aromatic and Aliphatic Acids.” Journal of Education and Science, vol. 28, no. 1, 2019, pp. 246-272.