
Journal of Advanced Biological Sciences
ISSN Print: N/A
ISSN Online: 3134-8823
About: Journal of Advanced Biological Sciences (JABS) is a peer-reviewed, open-access journal that aims to publish cutting-edge research and advancements in all areas of biological sciences. The journal serves as a platform for researchers, academicians, and professionals to contribute their scientific knowledge and foster innovation in biology-related fields.
Journal of Advanced Biological Sciences | Year 2024 | Volume 1 | Issue 1 | Pages 1-9
Assessment of Inflammatory Hematological Indices in Iraqi Patients with Fibromyalgia: A Case–Control Study
Fadya Ali Shaalan 1* and Sura Kasim Abbas21Al Furat General Hospital, Baghd7ad Health Directorate, Al-Karkh, Baghdad, Iraq
2Ibn Sina Training hospital, Ministry of Health, Baghdad, Iraq
View PDF Download XML Download DOI XML DOI: 10.66590/jabs2024010101
Abstract
Background: Fibromyalgia syndrome is characterized by chronic widespread pain accompanied by physical and psychological symptoms, often without a clearly defined pathological cause. Inflammatory markers derived from routine hematological parameters, such as the Neutrophil-to-Lymphocyte Ratio (NLR), Mean Platelet Volume (MPV) and Platelet Distribution Width (PDW), have been proposed as indicators of systemic inflammation. Objective: To evaluate NLR, MPV and PDW as inflammatory markers in patients with fibromyalgia. Patients and Methods: This case–control study was conducted at the Rheumatology Unit of Baghdad Teaching Hospital between July and November 2017. A total of 100 patients diagnosed with fibromyalgia according to the 2012 Canadian Guidelines and 50 healthy controls were included. Data collection involved structured questionnaires, clinical interviews and laboratory investigations. Hematological parameters, including MPV and PDW, were measured, while NLR was calculated manually from complete blood count data. Results: The neutrophil-to-lymphocyte ratio was significantly higher in patients with fibromyalgia (2.18) compared to healthy controls (1.92) (p = 0.033). Mean platelet volume was also significantly elevated in patients (8.3) relative to controls (8.0) (p = 0.045). In contrast, platelet distribution width was lower in patients (16.7) compared to controls (17.0), with a statistically significant difference (p = 0.01). No significant differences were observed in demographic variables between the groups. However, Receiver Operating Characteristic (ROC) analysis demonstrated that none of these parameters reached sufficient diagnostic accuracy (AUC<0.65) to serve as reliable diagnostic markers for fibromyalgia. Conclusion: Patients with fibromyalgia exhibit elevated NLR and MPV alongside reduced PDW, suggesting a possible inflammatory component in the disease. However, these hematological indices lack adequate diagnostic performance and should not be used independently for the diagnosis of fibromyalgia.
INTRODUCTION
Fibromyalgia
Fibromyalgia Syndrome (FMS) is a clinical designation employed to characterize the reduced life quality associated with caused by generalized body aches and psychological and physical symptoms, in the lack of a discernible pathological aetiology [1].
The absence of a definitive organic foundation for fibromyalgia, together with the elevated occurrence of affective disorders in individuals with fibromyalgia, prompted several observers to classified a psychosomatic illness or non-disease. In the 1980s, the word "fibrositis" was replaced by "fibromyalgia" because all efforts to demonstrate that connective tissue and muscle were inflamed or had other problems had failed [2,3].
Epidemiology
Fibromyalgia Syndrome (FMS) exhibits a notable prevalence of females, with a female-to-male ratio ranging from 7 to 9:1. While its peak incidence occurs between the ages of 20 and 60, FMS has also been identified in individuals across various age groups, including adolescents, older adults and children. Consequently, FMS is recognized as a significant concern within the realm of community health. Studies have reported its occurrence in 5% of patients attending general medical practices and up to 15% of patients seeking rheumatology care [4-9].
Etiology
The etiology of FMS remains elusive [10].
- Genetic: The prevalence of fibromyalgia is greater among first-degree relatives, suggesting a genetic predisposition to the disease, as they have 8.5 times more risk to have FMS compared to the general population [2,11]
- Environmental: Fibromyalgia has been linked to the occurrence of various forms of physical trauma, infectious disorders and emotional trauma [6,12,13]
Pathogenesis
Several mechanisms have been suggested including abnormal pain perception, sleep disturbance, abnormal circulating levels of central neurochemical substances and skeletal muscles abnormalities [14].
People with FMS also may have imbalances in any of the following brain chemicals: serotonin, melatonin, stress hormones, IGF-1growth hormone all showed low level, while substance P shows high levels and there is abnormal pain perception [6,15].
Clinical Feature
- Pain: The main presenting feature and dominant symptom is widespread pain lasting more than 3 months. According to the American College of Rheumatology (ACR), fibromyalgia is characterized as bilateral pain presented in regions both above and below the waist. Furthermore, the presence of pain in the axial skeleton (namely, the anterior chest, cervical spine, thoracic spine, or low back) is required. The condition often exhibits a lack of response to analgesic medications and Nonsteroidal Anti-Inflammatory Drugs (NSAIDs), while the use of physiotherapy frequently exacerbates the pain [16,17]
- Fatigue: Fatigue often exhibits a pattern of increased severity at awakening, gradual amelioration throughout the morning hours and subsequent exacerbation in the afternoon. The weariness encountered by patients is defined as quite debilitating. The evaluation and treatment of this symptom pose significant challenges because to potential factors such as depression, deconditioning, interrupted sleep, unpleasant effects of medication, or the presence of comorbid illnesses [18,19]
- Nonrestorative Sleep: Non-refreshing sleep is a prevalent characteristic seen in more than 90% of those diagnosed with fibromyalgia. The majority of patients have suboptimal sleep quality, which is characterized by feelings of fatigue, challenges in engaging in physical activities and impaired cognitive function [17]
- Morning Stiffness: Stiffness is generally present on arising in the morning; usually it improves during the day, but in some patients it lasts all day. This can be very debilitating; it was rated as the most troublesome symptom experienced by patient [18,20]
- Anxiety and Depression: Approximately 13–71 % of FMs patients have anxiety and 20–80 % have depression. Depression is often correlated with heightened weariness, decreased sleep quality and inadequate pain management. Conversely, individuals with anxiety commonly encounter symptoms such as palpitations, dizziness, perspiration and paresthesia [17,18]
- Impaired Cognition: Poor short-term memory as well as difficulty in learning a new task, processing information and problem solving are common complaints. It often described as brain fog [17]
- Other Symptoms: Individuals diagnosed with fibromyalgia may present with a range of symptoms that extend beyond the musculoskeletal system. These symptoms may manifest in various bodily systems, such as the gastrointestinal system, where patients may experience symptoms like vomiting, nausea, abdominal pain, diarrhea bloating and constipation. Additionally, urogynecologic symptoms, including frequency, incontinence, pelvic pain, urgency and dysmenorrhea, may also be reported. Furthermore, patients may exhibit neurologic symptoms such as paresthesia, vertigo, dizziness and tinnitus. Another common complaint among fibromyalgia patients is discomfort when touched, known as allodynia [16,17]
Diagnosis
Diagnosis of FMS depends on clinical evaluation only since no laboratory tests, or radiographic studies have been established to reach the diagnosis [21].
In 1990 the ACR defined diagnostic criteria based on a history of widespread musculoskeletal pain present for at least three months and tenderness in at least 11 of 18 defined tender points with sensitivity of 88.4% and a specificity of 81.1 %. These criteria were modified in 2010, the new criteria do not require the presence of tender point but Symptoms are evaluated using the Widespread Pain Index (WPI) and the Symptom Severity Score (SSS) of symptoms (fatigue, waking unrefreshed and cognitive symptoms) [19,22,23].
In 2012, the Canadian Rheumatology Association introduced a criterion for the diagnosis of FMS depending on presence of generalized body pain for more than 3 months associated with 4 non-pain symptoms (fatigue, sleep disturbance, cognitive changes and mood changes and any one of the other associated somatic symptoms [24].
Neutrophil-to-Lymphocyte Ratio (NLR)
Neutrophil-to-Lymphocyte Ratio (NLR) is a simple parameter to assess easily the inflammatory status of a subject [25]. It has been used in combination with other inflammatory markers to determine inflammation in both auto- and non-autoimmune diseases [26]. NLR has been associated with some conditions such as chronic inflammation in cardiovascular diseases, malignancies, ulcerative colitis and hepatic cirrhosis [27]. It calculated as the neutrophil count divided by the lymphocyte count, may represent an easily measurable and inexpensive marker of systemic inflammation [28,29].
Platelet Distribution Width (PDW)
Platelet Distribution Width (PDW) is a regular parameter in blood routine examination which reflects variation of platelet size distribution, measured by automatic hematology analyzer and calculated by measuring the width of the size distribution curve at the 20% level when the peak distribution curve is taken as 80% or 100%. There is always a morphological change when platelet is activated in the environment of inflammation. Thus, PDW can be utilized as a sign of activated platelet releasing in some inflammatory diseases. Studies have demonstrated that PDW level changes under specific conditions compared to healthy individuals [30,31]. Normal range of PDW 15-17%.
Mean Platelet Volume (MPV)
Mean Platelet Volume (MPV) is a parameter generated by full blood count analyzers as part of the routine complete blood count test. It is an accurate measure of platelet size and considered a marker and determinant of platelet function [32]. MPV increases as the platelet production increases and giant platelets enter the circulation. It was reported that MPV increase in massive hemorrhage, leukemia, myeloproliferative neoplas, vasculitis, diabetes, stroke, hypertension and post splenectomy [33,34]. Many recent researches have also focused on whether MPV is increased in patients with rheumatic diseases [35]. Normal range of MPV (7-11 FL).
The Relationship Between NLR, PDW and MPV with FMS
Fibromyalgia is a common disease whose etiology is not known precisely and its incidence is increasing. Recent studies indicate that inflammation may play a role in pathogenesis. In one study found that in the patient group, NLR and MPV were significantly higher and PDW was significantly lower compared to the control group. These markers can be inexpensively and easily evaluated in clinical practice and may help in the diagnosis [36].
Study Design
This case -control study was conducted at the Rheumatology Unit of Baghdad Teaching Hospital from July 2017 to November 2017.
Sample Selection
One hundred patients with Fibromyalgia (97 females: 3 male) diagnosed according to 2012 Canadian Guidelines for diagnosis of Fibromyalgia [24] were included in the study and compared with 50 healthy controls (47 female: 3 male).
Ethical approval was obtained from the Ethics Committee of Baghdad University, College of Medicine, Medical Department. Prior to the participation in the study, a verbal consent was obtained from each participant (patient and control). Data and information of the participants were kept confidentially and each personal or private information that identify the participant were kept secret.
Exclusion Criteria
Subacute or acute infections, Chronic inflammatory disorders, diabetes mellitus, hypertension, hypercholesterolemia, psychiatric or neurological disorders, malignancy, propensity to thrombotic or bleeding disorders or to be using anti-coagulant therapy.
Data Collection
Data were collected using a paper clinical research form through interview and questionnaires. It consisted of two parts:
The first part for the demographic data and full history including the age, gender, height, weight, Body Mass Index (BMI) calculated according to the equation BMI = weight/height 2. Each participant was asked about generalized body pain for more than 3 months, fatigue, sleep disturbance, cognitive changes (poor memory) and mood changes (anxiety or depression) in addition to other associated somatic symptoms like headache, dizziness, muscle cramp, chest pain, irritable bowel syndrome, abdominal pain …etc.
The second part laboratory data white blood cells count (WBC count), neutrophils count, lymphocytes count, platelets count, Platelet Distribution Width (PDW), Mean Platelet Volume (MPV) and ESR were recorded. Blood neutrophil-lymphocyte ratio for each participant was calculated manually by dividing the neutrophils count by lymphocytes count.
Collection of Blood Samples
Blood samples were collected from each participant under aseptic venipuncture and 5 ml of blood were collected from each patient and control.
We collect the blood in Ethylene Diamine Tetra Acetic acid (EDTA) tubes before sending them to laboratory to read the final results of Complete Blood Count (CBC) and ESR by automated analyzers in photometric pathway. NIHON KOHDEN® (Celltac α) and The VITAL MICROSED-SYSTEM ® ESR analyzer are the automated analyzer for getting the final results of CBC and ESR respectively.
Statistical Analysis
The data underwent a process of translation into a computerised database structure. The database undergone a thorough examination to identify errors via the use of range and logical data cleaning techniques. The statistical analyses were conducted using IBM SPSS version 21 software, often known as the Statistical Package for Social Sciences, in conjunction with Microsoft Excel 2016.
The analysis of the conformity of quantitative random variables to a Gaussian curve (normal distribution) was conducted via the use of the Kolmogorov-Smirnov test. The quantitative continuous outcome variables, including blood White Blood Cell (WBC) count, blood neutrophil count, blood lymphocyte count, Neutrophil to Lymphocyte Ratio (NLR) and Body Mass Index (BMI), were seen to follow a normal distribution. These variables are characterised by their mean, Standard Deviation (SD) and Standard Error (SE). The statistical significance of the difference in means between two groups was evaluated by the use of the independent samples t-test. On the other hand, for comparisons involving more than two groups, the Analysis of Variance (ANOVA) test was employed.
Blood platelets count, PDW and MPV were shown to be non-normally distributed quantitative variables. Such variables can be described by median and interquartile range. The difference in median between 2 groups was assessed by non-parametric test (Mann-Whitney), while between 3 groups Kruskal-Wallis test was used. A statistical estimate was deemed to be statistically significant if its P value was below a predetermined level of significance (α) of 0.05. The 95% Confidence Interval (CI) is a statistical method used to estimate the range of possible values for a calculated sample statistic in the reference population, with a confidence level of 95%. This procedure allows for the anticipation or prediction of the expected range of values with a high degree of confidence.
Spearman's rank linear correlation coefficient was used to assess the statistical significance, direction and strength of the linear correlation between two quantitative variables, with the consideration that one or both of these variables may not follow a normal distribution.
RESULTS
The results presented in this chapter were based on the analysis of a case-control study with a random sample of 100 cases (mean age of 35.7 +/- 10.2 years SD) with an established diagnosis of Fibromyalgia syndrome (FMS) and 50 healthy control subjects (mean age of 34.8 +/- 10 years SD). The age ranged between 17 and 60 years. The majority of cases were females (97%) and no significant case-control differences were observed in gender distribution. In addition, no case-control differences in age was observed.
The mean BMI should no obvious or statistically significant differences between cases with FMS (28.11 kg/m2) and healthy controls (28.01 kg/m2). In conclusion the two comparison groups were well matched for age, gender and BMI. These factors will not qualify as confounding variables when exploring for possible case-control differences in blood counts and platelets measurements (Table 1).
Table 1: Demographic Features of Cases and Controls
|
Parameters |
Study group |
P-Value |
|||
|
Healthy controls |
Cases (FMS) |
||||
|
N |
Percentage |
N |
Percentage |
||
|
Age group (years) |
0.66[NS] |
||||
|
<30 |
16 |
32.0 |
26 |
26.0 |
|
|
30-44 |
25 |
50.0 |
51 |
51.0 |
|
|
45+ |
9 |
18.0 |
23 |
23.0 |
|
|
Gender |
0.40[NS] |
||||
|
Female |
47 |
94.0 |
97 |
97.0 |
|
|
Male |
3 |
6.0 |
3 |
3.0 |
|
|
BMI |
0.91[NS] |
||||
|
Range |
)19.9-39.9) |
- |
(18.7-41.5) |
- |
|
|
Mean |
28.01 |
- |
28.11 |
- |
|
|
SD |
4.45 |
- |
5.22 |
- |
|
|
SE |
0.63 |
- |
0.52 |
- |
|
BMI: BODY MASS INDEX, N: Number, NS: Non-Significant, P: Probability Value
Description of FMS Cases
As shown in Table 2, a list of five basic clinical features were looked for among cases group. Four of these features were almost universal available (prevalence rate ranging between 96% to 100%), namely: diffuse pain for more than three months, fatigue, mood changes and sleep disturbance. The last feature, which is cognitive changes was less commonly reported (87%).
A list of 20 other clinical features were assessed among FMS cases. The prevalence of these clinical features in the current study sample was reported. The most commonly reported features include: headache, gases, abdominal pain and numbness/tingling reported in more than four fifths of cases. Ranked second in the list were frequent urination, easy bruising and shortness of breath with a prevalence rate between 60% and 70%. More than two fifths of FMS cases group reported shortness of breath, itching, palpitation, oral ulcers and tinnitus. Between a fifth and one third of cases had the following five features, namely: altered bowel motion, chest pain, bladder spasms, muscle cramps and Raynaud's. The remaining three features, namely: painful urination, dizziness and dry eyes were reported in ≤15% of cases.
Table 2: The Relative Frequency (Prevalence Rate) of Selected Basic and Other Clinical Features of FMS in Cases Group.
|
Basic clinical features (n = 100) |
N |
Percentage |
|
Diffuse pain >3 months |
100 |
100.0 |
|
Fatigue |
100 |
100.0 |
|
Mood Changes |
97 |
97.0 |
|
Sleep Disturbance |
96 |
96.0 |
|
Cognitive Changes |
87 |
87.0 |
|
Other clinical features (n = 100) |
||
|
Headache |
88 |
88.0 |
|
Gases |
85 |
85.0 |
|
Abdominal Pain |
83 |
83.0 |
|
Numbness/tingling |
81 |
81.0 |
|
Hair Loss |
70 |
70.0 |
|
Frequent Urination |
65 |
65.0 |
|
Easy bruising |
60 |
60.0 |
|
Shortness of Breath |
46 |
46.0 |
|
Itching |
44 |
44.0 |
|
Palpitation |
43 |
43.0 |
|
Oral ulcers |
43 |
43.0 |
|
Tinnitus |
42 |
42.0 |
|
Altered bowel motion |
33 |
33.0 |
|
Chest Pain |
31 |
31.0 |
|
Bladder Spasms |
27 |
27.0 |
|
Muscle Cramps |
20 |
20.0 |
|
Raynaud's |
19 |
19.0 |
|
Painful Urination |
15 |
15.0 |
|
Dizziness |
13 |
13.0 |
|
Dry eyes |
5 |
5.0 |
N: Number
Case-Control Difference in Blood Counts
As shown in Table 3, the mean blood WBC count was marginally and not significantly higher in cases with FMS (8.07) compared to healthy controls (7.63). The lymphocytes component of blood count did not show any obvious or statistically significant difference between cases and controls.
In contrast, the mean of both neutrophil count and neutrophil to lymphocyte ratio were significantly higher among cases with FMS (5.35 and 2.18 respectively) compared to healthy controls (4.77 and 1.92 respectively).
Table 3: The Case-Control Difference in Mean Blood Counts
|
Parameters |
Study group |
||
|
Healthy controls |
Cases (FMS) |
P |
|
|
Blood WBC count |
0.17[NS] |
||
|
Range |
(4.6 to 11) |
(4.1 to 15) |
|
|
Mean |
7.63 |
8.07 |
|
|
SD |
1.45 |
2.00 |
|
|
SE |
0.20 |
0.20 |
|
|
N |
50 |
100 |
|
|
Blood Neutrophil count |
0.021 |
||
|
Range |
(2.4 to 7) |
(2 to 11.6) |
|
|
Mean |
4.77 |
5.35 |
|
|
SD |
1.03 |
1.61 |
|
|
SE |
0.14 |
0.16 |
|
|
N |
50 |
100 |
|
|
Blood Lymphocytes count |
0.96[NS] |
||
|
Range |
(1.7 to 4.6) |
(0.9 to 4.5) |
|
|
Mean |
2.60 |
2.59 |
|
|
SD |
0.69 |
0.75 |
|
|
SE |
0.10 |
0.07 |
|
|
N |
50 |
100 |
|
|
Neutrophil to Lymphocytes ratio |
0.033 |
||
|
Range |
(0.89 to 3.29) |
(1.04 to 5) |
|
|
Mean |
1.92 |
2.18 |
|
|
SD |
0.54 |
0.75 |
|
|
SE |
0.08 |
0.08 |
|
|
N |
50 |
100 |
|
FMS: Fibromyalgia Syndrome, N: Number, NS: Non-significant, P: Probability Value, SD: Standard Deviation, SE: Standard Error, WBC: White Blood Cell
Case-Control Difference in Platelets Parameters
As shown in Table 4, all the three platelets parameters showed an obvious case-control difference in median, which only failed short of statistical significance in case of platelets count (316 for cases Vs 294 for controls).
Table 4: ROC Area for Selected Quantitative Tests When Used to Predict a Diagnosis of FMS Differentiating it from Healthy Control
|
Parameters |
Area under ROC curve |
P |
|
PDW |
0.628 |
0.011 |
|
Blood Neutrophil count |
0.602 |
0.041 |
|
MPV |
0.600 |
0.046 |
|
Blood platelets count |
0.597 |
0.05 [NS] |
|
Neutrophil to Lymphocytes ratio |
0.595 |
0.06 [NS] |
|
Blood WBC count |
0.566 |
0.19 [NS] |
|
Blood Lymphocytes count |
0.508 |
0.88 [NS] |
FMS: Fibromyalgia Syndrome, MPV: Mean Platelet Volume, NS: Non-Significant, P: Probability Value, PDW: Platelet Distribution Width, ROC: Receiver Operating Characteristic, WBC: White Blood Cell
The median MPV was significantly higher in cases with FMS (8.3) compared to healthy controls [8]. In contrast, the median PDW was significantly lower among cases with FMS (16.7) compared to healthy controls [17] (Figure 1).
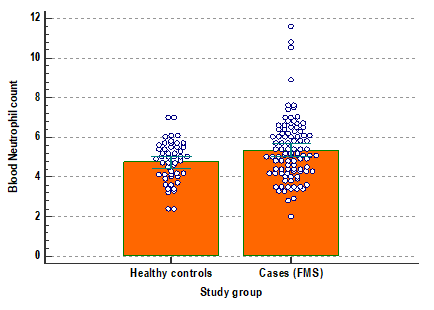
Figure 1: Dot Diagram with Error Bars Showing the Case-Control Difference in Mean Blood Neutrophil Count (with its 95% Confidence Interval)
FMS Effect Size on Blood Counts and Platelets Parameters
The ROC analysis gives an idea about ranking the tested parameters according to the effect size for FMS compared to healthy controls. At the top of the list is the PDW was the parameter most affected by FMS, followed by blood neutrophil count and MPV. The blood platelets count and neutrophil to lymphocytes ratio occupied the 4th and 5th places in the list of tested parameters. The blood WBC and lymphocytes counts failed to show a statistically significant or noticeable effect for FMS (Figure 2).
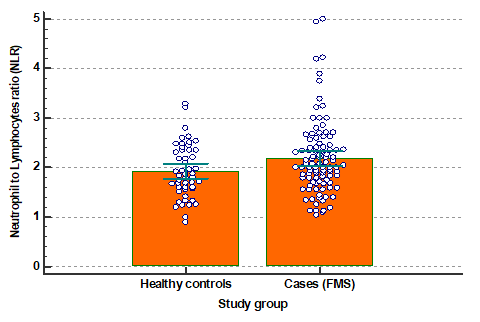
Figure 2: Dot Diagram with Error Bars Showing the Case-Control Difference in Mean Blood Neutrophil to Lymphocytes Ratio (With Its 95% Confidence Interval)
Screening for FMS
As shown in Table 5, none of the 6 tested parameters qualified as an acceptable test for predicting a diagnosis of FMS, since the ROC area associated with any of them did not reach the minimum ROC area value of 0.65.
Table 5: Validity Parameters for Selected Quantitative Tests when Used to Predict a Diagnosis of FMS Differentiating it from Healthy Control (Higher Values are in Favor of Positive Diagnosis)
|
Positive if ≥ cut-off value |
Sensitivity |
Specificity |
Accuracy |
PPV at pretest probability = |
NPV at pretest probability = 10% |
|
|
50% |
90% |
|||||
|
Blood WBC count |
||||||
|
4.70 (Highest sensitivity) |
98.0 |
2.0 |
66.0 |
50.0 |
90.0 |
90.0 |
|
7.85 (Optimum cut-off) |
55.0 |
64.0 |
58.0 |
60.4 |
93.2 |
92.8 |
|
11.45 (Highest specificity) |
3.0 |
100.0 |
35.3 |
100.0 |
100.0 |
90.3 |
|
Blood Neutrophil count |
||||||
|
2.60 (Highest sensitivity) |
99.0 |
4.0 |
67.3 |
50.8 |
90.3 |
97.3 |
|
5.05 (Optimum cut-off) |
55.0 |
60.0 |
56.7 |
57.9 |
92.5 |
92.3 |
|
7.01 (Highest specificity) |
9.0 |
100.0 |
39.3 |
100.0 |
100.0 |
90.8 |
|
Blood Lymphocytes count |
||||||
|
1.75 (Highest sensitivity) |
89.0 |
2.0 |
60.0 |
47.6 |
89.1 |
62.1 |
|
2.55 (Optimum cut-off) |
48.0 |
66.0 |
54.0 |
58.5 |
92.7 |
92.0 |
|
4.05 (Highest specificity) |
4.0 |
98.0 |
35.3 |
66.7 |
94.7 |
90.2 |
|
Neutrophil to Lymphocytes ratio (NLR) |
||||||
|
1.02 (Highest sensitivity) |
100.0 |
4.0 |
68.0 |
51.0 |
90.4 |
100.0 |
|
1.99 (Optimum cut-off) |
57.0 |
62.0 |
58.7 |
60.0 |
93.1 |
92.8 |
|
3.34 (Highest specificity) |
7.0 |
100.0 |
38.0 |
100.0 |
100.0 |
90.6 |
|
Blood platelets count |
||||||
|
200 (Highest sensitivity) |
100.0 |
10.0 |
70.0 |
52.6 |
90.9 |
100.0 |
|
306 (Optimum cut-off) |
56.0 |
68.0 |
60.0 |
63.6 |
94.0 |
93.3 |
|
536 (Highest specificity) |
1.0 |
100.0 |
34.0 |
100.0 |
100.0 |
90.1 |
|
MPV |
||||||
|
6.80 (Highest sensitivity) |
99.0 |
2.0 |
66.7 |
50.3 |
90.1 |
94.7 |
|
8.10 (Optimum cut-off) |
56.0 |
66.0 |
59.3 |
62.2 |
93.7 |
93.1 |
|
16.50 (Highest specificity) |
1.0 |
98.0 |
33.3 |
33.3 |
81.8 |
89.9 |
FMS: Fibromyalgia Syndrome, MPV: Mean Platelet Volume, NP: Negative Predictive Value, PPV: Positive Predictive Value, WBC: White Blood Cell
The optimum cut-off value for each parameter is stated in table 6. One can see that at the optimum cut-off value for any of the tests the highest accuracy will not exceed 64% at best. The contribution of a positive test at the optimal cut-off value for any of the 5 parameters in which the test follows a positive direction (higher values are in favor of positive diagnosis of FMS) would not be much compared to a pretest probability of 50% or 90%. The same applies to PDW, which operates in the negative direction (smaller values are in favor of positive diagnosis of FMS) which is considered positive when <16.85 at the optimum cut-off value (Figure 3).
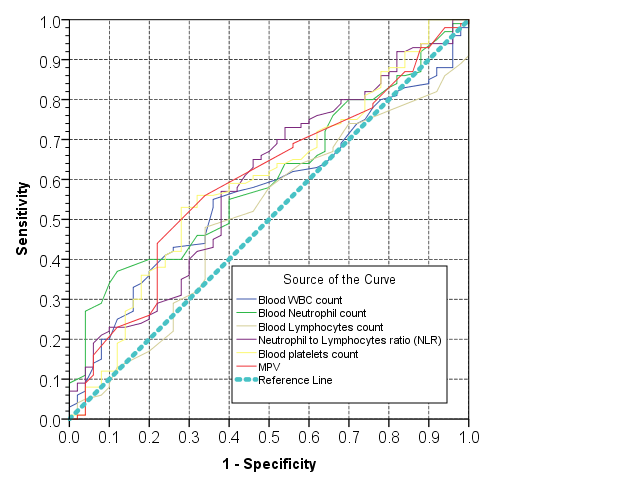
Figure 3: ROC Curve Showing the Trade-Off Between Sensitivity (Rate of True Positive Test Results) and 1-Specificity (False Positive Rate) for Selected Quantitative Measurements when Used as Test to Predict FMS Differentiating it from Healthy Controls
DISCUSSION
Up to the best of our knowledge this is the first study that investigate the NLR, PDW and MPV values in FMS patients in comparison with healthy control in a sample of Iraqi patients.
From the data collected in the study, the mean age of patients included in the study was 35.7 +/- 10.2 SD years, which was comparable to that of the control group 34.8 +/- 10 years SD, (p-value = 0.66), females were the dominant gender (97%). This had also been concluded by Aktürk S et al. [36], in their study on Fibromyalgia patients in Turkey. Moreover, the difference in the height, weight and body mass index between the two groups were statistically insignificant (p-value = 0.91).
Regarding the basic clinical features prevalence in FMS, all of the patients in this study have fatigue and diffuse pain >3 months which were similar to Bennett R et al. [37], results. On the other hand, the prevalence of mood changes, sleep disturbance and cognitive changes were 97%, 96% and 87% respectively, which were comparable to the study done by Fitzcharles M et al. [38].
Other clinical features including headache, gases, abdominal pain, numbness/tingling, hair loss, frequent urination and easy bruising were ranging from (60%-88%), while less than half of those patients had shortness of breath, itching, palpitation, oral ulcers, tinnitus, altered bowel motion, chest pain, bladder spasms, muscle cramps, raynaud's, painful urination, dizziness and dry eyes.
Neither the mean blood WBC count nor the lymphocytes component showed statistically significant difference between cases and controls. In contrast, the mean of both neutrophil count and neutrophil to lymphocyte ratio were significantly higher among cases with FMS compared to healthy controls, which were consistent with that reported in a study done by Aktürk S et al. [36] in 2017.
It was reported that NLR can be utilized as a predicting marker to estimate the response of systemic inflammatory. Neutrophil-to-Lymphocyte Ratio (NLR) has been extensively investigated in systemic illnesses characterised by elevated neutrophil counts and reduced lymphocyte counts. This observed correlation between NLR and lymphocyte reduction may be attributed to factors such as acute inflammatory, lymphocyte reduction and physiological stress [27,39-41].
In their study, Taşoğlu et al. [39], conducted an assessment of the association between severe knee osteoarthritis and Neutrophil-to-Lymphocyte Ratio (NLR). The findings of their investigation revealed that individuals diagnosed with severe knee osteoarthritis had elevated NLR values in their blood samples when compared to those with moderate knee osteoarthritis. In contrast, FMS is chronic but not degenerative and in the current study, the NLR levels were significantly higher in FMS patients compared to healthy controls, this agreed with Aktürk S et al. [36] results.
It was reported that MPV increase in thrombotic diseases or inflammatory [42,43]. In this study, the median MPV was significantly higher in patients with FMS compared to healthy controls, which was consistent with the result reported by Haliloğlu et al. [44] that showed the MPV was increased in FMS patients.
On the other hand, the median PDW in the present study was significantly lower among FMS patients compared to healthy controls which was similar to the results done by Aktürk S et al. [36].
The validity of (NLR, MPV and PDW) was assessed as a predictor for the diagnosis of FMS, using two methods of analysis; the first method used the ROC curve and the second method cut-off value.
Regarding the ROC curve, the PDW was the most affected one followed by blood neutrophil count and MPV, whereas the blood platelets count and NLR occupied the 4th and 5th places respectively. The NLR had 57% sensitivity, 62% specificity and 58.7% accuracy, MPV had 56% sensitivity, 66% specificity and 59.3% accuracy, PDW had 62%sensitivity, 68% specificity and 64% accuracy.
The most important limitations of our study are: first, the parameters values were measured only once in each patient. Second, Restriction in the studies that assessed the role of these parameters in the diagnosis of FMS. Third, small sample size and short period of time for the study.
However, they are cheap and easy tests to be performed as it is a common component of the Complete Blood Count (CBC) test that is nowadays widely distributed in nearly every health care facility and by an automated machine.
CONCLUSIONS
The NLR is significantly higher in FMS patients compared to healthy controls. The MPV is significantly higher in patients with FMS compared to controls. The PDW was significantly lower among FMS patients compared to healthy controls. None of these tested parameters qualified as an acceptable test for predicting a diagnosis of FMS.
Recommendations
The three tested parameters alone may not be dependent as a marker or predictor for diagnosing FMS. Larger sample size and longer duration study to further validate the findings of this study.
REFERENCES
- Walitt, B. et al. “The prevalence and characteristics of fibromyalgia in the 2012 national health interview survey.” PLOS One, vol. 10, no. 9, September 2015, pp. e0138024.
- Hawkins, R.A. “Fibromyalgia: A clinical update.” The Journal of the American Osteopathic Association, vol. 113, no. 9, September 2013, pp. 680–689.
- Smith, H.S. et al. “Fibromyalgia: An afferent processing disorder leading to a complex pain generalized syndrome.” Pain Physician, vol. 14, no. 2, March 2011, pp. E217–E245.
- Al-Osami, M.H. et al. “Apolipoprotein (a) as predictive factor in fibromyalgia syndrome.” Journal of the Faculty of Medicine, vol. 52, no. 2, 2010, pp. 217–220.
- Chen, J.L. and A.M. McKenzie-Brown. “The epidemiology and prevalence of fibromyalgia (fms).” fibromyalgia: Clinical Guidelines and Treatments, edited by E. Lawson and M.S. Wallace, Springer International Publishing, 2015, pp. 1–21.
- Al-Rawi, Z.S. et al. “Fibromyalgia syndrome among iraqi female patients with breast cancer.” Pan Arab Journal of Oncology, vol. 6, no. 2, 2013, pp. 30–33.
- Al-Bidri, K.Z. et al. “Fibromyalgia syndrome in a sample of iraqi patients with psoriasis.” Journal of the Faculty of Medicine, vol. 56, no. 1, 2014, pp. 49–52.
- Jassim, N.A. et al. “Fibromyalgia syndrome in chronic obstructive pulmonary disease.” Journal of the Faculty of Medicine, vol. 51, no. 1, 2009, pp. 31–33.
- Al-Bidri, K.Z.M. “Prevalence of Fibromyalgia in Iraqi People with Joint Hypermobility Syndrome.” The Iraqi Academic Scientific Journal, vol. 7, no. 1, 2008, pp. 18–21.
- Alosami, M.H. “The role of resistin in patients with primary fibromyalgia.” Journal of the Faculty of Medicine, vol. 53, no. 2, 2011, pp. 152–155.
- Arnold, L.M. et al. “Family study of fibromyalgia.” Arthritis and Rheumatism, vol. 50, no. 3, 2004, pp. 944–952.
- Al-Rawi, Z.S. et al. “Prevalence of fibromyalgia in Iraqi patients with ischemic heart disease.” Journal of the Faculty of Medicine, vol. 51, no. 2, 2009, pp. 127–129.
- Jassim, N.A. et al. “Fibromyalgia syndrome in 104 Iraqi patients with inflammatory bowel disease.” The Iraqi Academic Scientific Journal, vol. 10, no. 3, 2011, pp. 352–357.
- Mayouf, K.Z. et al. “Prevalence of fibromyalgia syndrome in patients with hemophilia A.” The Iraqi Academic Scientific Journal, vol. 9, no. 1, 2010, pp. 80–83.
- Al-Gebori, A.M. et al. “Determination of anti-cyclic citrullinated peptide (ACCP) and C-reactive protein (CRP) concentrations in serum of patients with fibromyalgia syndrome (FMS).” The Iraqi Academic Scientific Journal, vol. 10, no. 1, 2011.
- Clunie, G.P.R. and S.H. Ralston. “Rheumatology and bone disease.” Davidson’s Principles and Practice of Medicine, 23rd ed., edited by S.H. Ralston et al., Elsevier, 2018, pp. 1018.
- Choy, E.H.S. “The patient with diffuse pain.” Current Diagnosis & Treatment Rheumatology, 3rd ed., edited by J.B. Imboden et al., McGraw-Hill Education, 2013, pp. 132–133.
- Henriquez, O.H. and D. Peck. “Fibromyalgia diagnosis.” Fibromyalgia: Clinical Guidelines and Treatments, edited by E. Lawson and M.S. Wallace, Springer International Publishing, 2015, pp. 23–34.
- Crofford, L.J. “Fibromyalgia.” Kelley & Firestein’s Textbook of Rheumatology, 10th ed., edited by G.S. Firestein et al., Elsevier, 2017, pp. 769–775.
- Langford, C.A. and B.C. Gilliland. “Fibromyalgia.” Harrison’s Rheumatology, 2nd ed., edited by A.S. Fauci and C.A. Langford, McGraw-Hill Education, 2010, pp. 255.
- Dymon, T.E. Fibromyalgia. In: Dong, B.J. et al. Neurologic and Psychiatric Care. ACCP, 2015, pp. 5–18.
- Bellato, E. et al. Fibromyalgia syndrome: etiology, pathogenesis, diagnosis and treatment. Pain Research and Treatment, 2012.
- Hammody, L.E. et al. “Pregabalin versus amitriptyline in the treatment of fibromyalgia patients (A double blind comparative study).” Iraqi Academic Scientific Journal, 2015, vol. 14, no. 1, pp. 38–44.
- Fitzcharles, M.A. et al. “2012 Canadian guidelines for the diagnosis and management of fibromyalgia syndrome: executive summary.” Pain Research and Management, 2013, vol. 18, no. 3, pp. 119–126.
- Forget, P. et al. “What is the normal value of the neutrophil-to-lymphocyte ratio.” BMC Research Notes, December 2017, vol. 10, no. 1, pp. 12.
- Farouk, H.M. et al. “Neutrophil/lymphocyte and platelet/lymphocyte ratios and their relation with disease activity in systemic lupus erythematosus patients.” Egyptian Journal of Hospital Medicine, October 2017, vol. 69, no. 1.
- Uslu, A.U. et al. “Is neutrophil/lymphocyte ratio associated with subclinical inflammation and amyloidosis in patients with familial Mediterranean fever?” BioMed Research International, 2013.
- Mikhael, E.M. and T.N. Ibrahim. “Neutrophil/lymphocyte ratio is not correlated with disease activity in rheumatoid arthritis patients.” Iraqi Journal of Pharmaceutical Sciences, March 2017, vol. 22, no. 2, pp. 9–14.
- Orditura, M. et al. “Neutrophil to lymphocyte ratio (NLR) for prediction of distant metastasis-free survival (DMFS) in early breast cancer: A propensity score-matched analysis.” ESMO Open, March 2016, vol. 1, no. 2, e000038.
- Wang, F. et al. “Distribution width levels can be a predictor in the diagnosis of persistent organ failure in acute pancreatitis.” Gastroenterology Research and Practice, 2017.
- Yang, S.W. et al. “Significance of the platelet distribution width as a severity marker for the development of preeclampsia.” European Journal of Obstetrics and Gynecology and Reproductive Biology, April 2014, vol. 175, pp. 107–111.
- Köşüş, N. et al. “Relationship of ovarian volume with mean platelet volume and lipid profile in patients with polycystic ovary syndrome.” Experimental and Therapeutic Medicine, November 2011, vol. 2, no. 6, pp. 1141–1141145.
- Sachdev, R. et al. “Establishing biological reference intervals for novel platelet parameters and their correlations among each other.” Indian Journal of Pathology and Microbiology, April 2014, vol. 57, no. 2, pp. 231.
- Cumhur Cure, M. et al. “Mean platelet volume and vitamin D level.” Annals of Laboratory Medicine, March 2014, vol. 34, no. 2, pp. 98–103.
- Hao, X. et al. “The Relationship between hematological indices and autoimmune rheumatic diseases (ARDs), a meta-analysis.” Scientific Reports, September 2017, vol. 7, no. 1, pp. 10833.
- Aktürk, S. and R. Büyükavcı. “Evaluation of blood neutrophil-lymphocyte ratio and platelet distribution width as inflammatory markers in patients with fibromyalgia.” Clinical Rheumatology, August 2017, vol. 36, no. 8, pp. 1885–1889.
- Bennett, R.M. “The rational management of fibromyalgia patients.” Rheumatic Disease Clinics, May 2002, vol. 28, no. 2, pp. 181–199.
- Fitzcharles, M.A. et al. “Fibromyalgia: Evolving concepts over the past 2 decades.” Canadian Medical Association Journal, September 2013, vol. 185, no. 13, pp. E645–E651.
- Taşoğlu, Ö. et al. “Is blood neutrophil-lymphocyte ratio an independent predictor of knee osteoarthritis severity?” Clinical Rheumatology, June 2016, vol. 35, no. 6, pp. 1579–1583.
- Galizia, G. et al. “Neutrophil to lymphocyte ratio is a strong predictor of tumor recurrence in early colon cancers: A propensity score-matched analysis.” Surgery, July 2015, vol. 158, no. 1, pp. 112–120.
- Tekeoğlu, İ. et al. “Overlooked hematological markers of disease activity in rheumatoid arthritis.” International Journal of Rheumatic Diseases, November 2016, vol. 19, no. 11, pp. 1078–1082.
- Klovaite, J. et al. “High platelet volume and increased risk of myocardial infarction: 39,531 participants from the general population.” Journal of Thrombosis and Haemostasis, January 2011, vol. 9, no. 1, pp. 49–56.
- Gasparyan, A.Y. et al. “Mean platelet volume: A link between thrombosis and inflammation?” Current Pharmaceutical Design, January 2011, vol. 17, no. 1, pp. 47–58.
- Haliloğlu, S. et al. “Mean platelet volume in patients with fibromyalgia.” Zeitschrift für Rheumatologie, October 2014, vol. 73, no. 8, pp. 742–745.