
Advanced Research Journal of Computer Science
ISSN Print: N/A
ISSN Online: 3134-884X
About: The Advanced Research Journal of Computer Science (ARJCS) is a peer-reviewed, open-access journal dedicated to publishing high-quality research and review articles in the field of computer science. ARJCS serves as a global platform for researchers, academicians, and industry professionals to share innovative ideas, cutting-edge developments, and practical applications in computing and information technology.
Advanced Research Journal of Computer Science | Year 2024 | Volume 1 | Issue 1 | Pages 1-8
Crop Density Estimation using Unmanned Aerial Vehicle Images
Rida Afzal 1*11Computer Science Department, University of Agriculture Faisalabad, Pakistan
View PDF Download XML Download DOI XML DOI: 10.66590/arjcs2024010101
Abstract
As we know well that the economy of our country is based upon agriculture. It is a basic source to get food. As the population of our country has increased, so our basic need is to fulfill the food requirements. So, I used different modern methods to identify the crop density. In this research I tried to replace the old methods with modern techniques which are more efficient and cost effective. RGB images were used with higher resolution camera in order to identify the green pixels of the plants. If density of crop is higher, then crop growth and its health would also be increased. The components of crop rows will identify by extracting them. Functioning of crop was very important in order to identify the different features like water, yield and requirement of fertilizers along with susceptibility towards pathogens. Wheat is the most common crop which is cultivated along whole world having different ranges. The population density of plants is very important in competition among different plants along weeds and their effective usage on the availability of sources like water, light and nutrients. With this technique, I was able to collect visual plants into a field on a specific area in order to collect the sample. The use of NDVI (Normalized Difference Vegetation Index) agriculture and different drone sensors were the basic indicator of health for the plants. Live green plants can absorb a large amount of solar radiation and it could be used as the primary source of energy in the basic process of photosynthesis.
INTRODUCTION
The wheat is the most important crop in the whole world. The most important variables we drive from any yield potential is crop density. That explanation is used why it’s important for the cultural practices of management. In a segment or quadrat, the plant density investigation is still continuous by counting number of plants in a field or selected sample segment or place. This stage is achieved after few weeks or days. But this method is labor or time intensive and may be due to human error prone. For quantifying plant density some effort has been dedicated to the development of high throughput methods [1].
In advance methods UAV was introduced. Now the development of cost effective, portable or lightweight sensors was introduced in which we capture images in all dimensions by using drones. Further we apply the different toolbox of mat lab. Plant density is the basic key point which is directly affecting the crop functioning including different aspects like fertilizer requirements, water and yield along with susceptibility towards pathogens. Past research on the wheat of winter has showed that density of plant is related to the green fraction, the yield and accumulation of dry matter.
But, the tillering capacity for wheat crop allow to compensate variability towards plant density We use any field or crop that we want to identify the density of plant or crop. We capture aerial images with the help of drones. All images that used for further processing Capturing in all dimensions or directions.
Drones are used where human access is impossible or at high risk. We used this method because visually counting plants it’s a difficult task or occur many human errors. Today Precision agriculture is widely used. By using this term, you have ability to take decision how to reduce waste or protect the environment and maximize the profit. We use PA (Precision agriculture) by spraying
we use input resources such as seeds, water, nutrients or pesticides to improve the efficiency or production of crops. The basics purpose of all these that we reduce heterogeneity spacing among plants in every row or maximum the density estimation among plants. For this we identify or introduce a model to find number of plants in each row. Also, it is used to identify the strength of any plant or crop.
Objectives
My main objectives to achieve in this research are:
- Due to a large variety of crops, it is very difficult for us to find out the specific number of plants, so, our main purpose is to develop a method like “Density estimation” with the help of modern technology like computer vision and UAV (Unmanned Aerial Vehicle)
- The main purpose of this study is to introduce such a system which is based on imagery of high resolution that can measure the population density of wheat plants
- Third objective is measuring crop density is very boring, labor intensive and costly to reduce it
In drone we use mobile to capture images then we further imaging processing using computer vision tool box in MATLAB. Comprehensive set of workflow-apps and algorithms of reference-standard can be determined with the help of image processing toolbox. Work flow applications are for analysis, algorithm development, visualization and image-processing. With help of this, we can perform 3D image processing, geometric transformations, image enhancement, and image registration and noise reduction. First, we have an image which original or aerial image. Then we apply image processing using computer vision toolbox of MATLAB. After apply filter we can identify feature detection or extraction of any plant or crop further classification of extraction images and finally distribute plant spacing or number of plants per row.
Any field that we use in our project is a square area that we use to capture images of any crop than we use it for further processing. Like we use this field to identify the crop density. Crop density means to identify the number of plants per row or area. Generally, density is a ratio of mass or volume.
The current methods used are based on visual plant counting in the fields over a predefined sampling area. They are tedious, time consuming and prone to human errors. Further, the soil conditions, particularly in case of rainfall or frost, may limit the time slots when walking in the field is possible without damaging the crop. Therefore, it is difficult to measure the plant density using such manual method when applied to large fields for documenting the spatial variability, or when applied to large phenotyping experiments with several hundred to several thousands of microplots to be characterized. It is thus necessary to develop alternative methods to provide timely and accurate quantification of the plant density. Precision agriculture (PA) is also defined as site of specific crop management (SSCM). By rational use of the balance resources or inputs it permits permission to the farmer too costly like Chemicals used only where or when they are essential. In further it is vital or necessary component of the system to promotion of the environmental stewardship.
Precision agriculture (PA) is not skill, it is a controlling idea to respond to three-dimensional inconsistency but PA technology makes it possible. The aim of Precision agriculture is to manage, examine and classify three dimensional and historical inconsistency with all facts of yield production in a field for best productivity, caring, sustainability and profitability for protection of environment and land resources because precision agriculture is a multi-disciplinary method. Once we obtain the variations than we see the reason behind these variation. Then try to remove or solve this variation by using the agricultural inputs or location bases within agriculture field. For obtaining maximum production it’s necessary to protect crop from diseases.
During recent decades several sensor techniques have been tested for crop density estimation. They can be divided in two categories based on the measurement principle, used; i.e. contact sensors and non-contact sensors. Contact sensors measure the deviation of a movable component of the sensor by virtue of its contact with the crop. The amplitude or frequency of this deviation is then registered and used as a measure for the crop density.
Unmanned Aerial Vehicles (UAV) images are typically collected via a flight mission with low altitude and large overlapping rate, whose spatial resolution is generally less than 10 cm. In contrast to the meter or decimeter-scale satellite image or aerial photographs, such UAV images are quite suitable for applying to detection of the occurrence of newly grown leaves over a tree crown or forest canopy.
As mentioned previously, newly grown leaves that randomly spread over tree crowns within a forest stand are quite small in size and less populous in the number of pixels particularly at the early and late stages in annual growing season. Success in detecting new leaves using remotely sensed data can help to determine the length of growing season and therefore potentially be of benefit in identifying or measuring how trees adapt or react to environmental change. So, the objectives of this paper were to investigate:
- The possibility of detecting new foliage from spectra-limited UAV bitmap images using hyperspectral target detection techniques,
- The performance of active and passive target detection techniques in differentiating the new foliage and their background targets, and
- The possibility of successful detection of new foliage using decimeter scale remote sensing images
UAV (unmanned aerial vehicle) is used for the purpose of to reach the target area that we use to wand see or also use it to destroy the target area of enemy because unmanned aerial vehicle contains sensors, violet weapons, spreader design and target designators. For manned aircraft system design the support life system and safety requirements for pilot protection in aircraft, while in unmanned aerial vehicle systems no pilot needs just controlling it on standing the earth and these systems are more accurate or efficient because where human reach is not possible, we use these vehicles.
However, none of these investigations specifically addressed the estimation of plant density. Advances in digital photography providing very high-resolution images, combined with the development of computer vision systems, offer new opportunities to develop a non-destructive high through put method for plant density estimation.
The objective of this study is to develop a system based on high resolution imagery that measures wheat plant population density at early stages. The methods used to acquire the RGB images and the experimental conditions are first presented. Then the pipeline developed to process the images is described. Finally, the method is evaluated with emphasis on its accuracy and on its corresponding domain of validity.
The normalized difference vegetation index (NDVI) can be used as sampling graphical indicator that could be used in order to analyze the distant sensing measurement, usually, but not essentially, formed a space platform, and evaluate whether the targeted object being perceived comprises lively green vegetation or maybe not.
The normalized difference vegetation index (NDVI), which was basically derived from remote satellite (sensing) data, was carefully connected to drought conditions. In order to determine the density of green vegetation on the square of a land, the discrete colors of various wavelengths of near-infrared and visible sunlight reproduced by the plants are being observed [2].
The values of NDVI changed between + 1.0 and − 1.0. The healthy vegetation had high near-infrared and lowered red-light reflectance that could produce higher values of NDVI. The mounting quantity of the positive values of NDVI specifies the increase within quantity of green vegetation. The values of NDVI near negative and about zero values indicated non-vegetated structures like barren surfaces (soil and rock), clouds, ice, snow and water. In this paper, the NDVI data was again rescaled to 0–255 in order to store the results within unspecified 8-bit data [2].
In order to investigate the density of green color on the specific patch of land, investigators should observe the discrete colors of near-infrared and visible sunlight (wavelengths) reflected through the plants. It could be seen with the help of prism; several altered wavelengths made the spectra of sunlight. When this light strikes on objects, definite wavelength of sunlight spectrum was absorbed, while all other wavelengths were reflected. The main pigment (chlorophyll) within leaves of plant powerfully absorbed visible light (ranging from 0.4-0.7 µm) for being used in the process of photosynthesis. The main cell structure of the plant leaves, on the other side, powerfully reflect the near-infrared light (from 0.7-1.1 µm). If a plant has a greater number of leaves, then, more quantity of these wavelengths is being affected.
Plant density and its non-uniformity drive the competition among plants as well as with weeds. They need thus to be estimated with small uncertainties accuracy. An optimal sampling method is proposed to estimate the plant density in wheat crops from plant counting and reach a given precision.
Crop density is a key agronomical trait used to manage wheat crops and estimate yield. Visual counting of plants in the field is currently the most common method used. However, it is tedious and time consuming. The main objective of this work is to develop a machine vision-based method to automate the density survey of wheat at early stages. RGB images taken with a high resolution RGB camera are classified to identify the green pixels corresponding to the plants. Crop rows are extracted and the connected components (objects) are identified. A neural network is then trained to estimate the number of plants in the objects using the object features. The method was evaluated over three experiments showing contrasted conditions with sowing densities ranging from 100 to 600 seeds. Results demonstrate that the density is accurately estimated with an average relative error of 12%. The pipeline developed here provides an efficient and accurate estimate of wheat plant density at early stages.
A field is defined in agriculture an area of the land used for agricultural purpose, nurturing of crop or also used as cattle. A field may also define or used unsown or unplanted [3].
Many farms are used for growing vegetables, which are used for the purpose to provide food for human as well as animals and also provide the shelter for wildlife. Many farms have border and used for the variety of plants or animals and this causes to reduce the crop yield.
Technology is rapidly changing the methods with which wildlife is being monitored. Unmanned aerial vehicles (UAVs) are one such example of new technology that allows biologists to take to the air to monitor wildlife, allowing for more cost-effective wildlife monitoring. UAVs allow for very high-resolution data acquisition in both the spatial and temporal domain. UAVs have been used in several civilian disciplines for research and monitoring: agriculture, forestry, and biodiversity monitoring including wildlife. The use of UAVs in wildlife studies is relatively recent and has focused more on the possibility of species detection.
The saturation problem associated with the use of NDVI for biomass estimation in high canopy density vegetation is a well-known phenomenon. Recent field spectroscopy experiments have shown that narrow band vegetation indices computed from the red edge and the NIR shoulder can improve the estimation of biomass in such situations.
In some causes we see that at the same area crop density is different it is because of many factors are include that causes crop density variations like: climate, land situation, amount of water, amount of fertilizer and many others factors in favors or against the crop density. As we know that our country economy based on agriculture therefore it is an important to increase the crop growth and health. Crop density estimation helps us to determine the crop health very clearly.
Today Precision agriculture is widely used. By using this term, you have ability to take decision how to reduce waste or protect the environment and maximize the profit. We use PA (Precision agriculture) by spraying we use input resources such as seeds, water, nutrients or pesticides to improve the efficiency or production of crops. The basics purpose of all these that we reduce heterogeneity spacing among plants in every row or maximum the density estimation among plants. For this we identify or introduce a model to find number of plants in each row. Also, it is used to identify the strength of any plant or crop [4].
In some causes we see that at the same area crop density is different it is because of many factors are include that causes crop density variations like: climate, land situation, amount of water, amount of fertilizer and many others factors in favors or against the crop density. As we know that our country economy based on agriculture therefore it is an important to increase the crop growth and health. Crop density estimation helps us to determine the crop health very clearly. Crop density is considering an important factor that supports in determining the crop yield. As we know that crops are extent along a very huge area. Manually or field methods for measuring crop density is very boring, labor intensive and costly. For large amount of crop or non-uniformity of plants it tough to find out number of plants so, the main objective of this work is to develop a method “density estimation” using modern technology such as UAV (Unmanned Aerial Vehicle) and computer vision.
Review of Literature
Mahesh et al. [5] investigated a method for getting the maximum yield of combine harvester, constantly intake of biomass was very important within threshing system was needed to be maintained. In order to achieve this, combined driver must be maintained by adjusting its speed continuously in accordance with the amount of biomass used on the front side of header. This presents the high pressure on the operator, who had used different other processes like cleaning and threshing.
Thorp et al. [6] describe that estimation of stand density of corn plant was best by the use of imagery collected at early reproductive growth stages of corn and the later vegetative stages. Among different types of cases which was plot, spatial resolution and image date, the basic constituents of reflectance mostly correlated with plant’s stand density were become able in order to classified within four prominent types, denoted in the form of types (A, B, C, and D). Type’ A’ basic components compared all wavelengths of visible red along all available wavelengths of near infrared. Type B basic components distinguished green wavelengths (nm) plus short wave near-infrared (nm) along red wavelengths ranging from 675nm to 693 nm with longer wave near-infrared of about 852 nm. Type C basic components included green wavelengths ranging from 528nm to 546 nm and near-infrared wavelengths ranged from 717nm to 855 nm. Type D basic components contrasted green/blue wavelengths ranged from 498nm to 507 nm along red edge of about 717 nm. Remote sensing could be accurately used in order to estimate stand density of corn plant at mid time of season as long as existence of plant stand variability and variability due to other various factors was minimal.
Moritz et al. [7] further proposed that systems like automatic feed-rate control can be used to enlighten the basic purpose of operator with the adjustment of driving speed in accordance with the quantity of biomass entered in the straw elevator. Currently, the incoming quantity of biomass was determined by torque on the drive belt header or the feeder.
Saeys et al. [8] according to his crop density means rate of feed was usually determined when material of crop was cut and loaded within machines. That disadvantages the control system operating automatically as compared to human operator which was able to view the density of crop in front of machines and can be able to estimate volume. But speed controllers working automatically always operated too late, a little bit, and can proceeds towards sub-optimal performance. Having an aim of increased comfort and speed, it was expected that a little information on the biomass quantity some meters in front of header would help in order to enhance the automatic control system.
Parker [9] described that due to crop density estimation or irregularity a competition occurs among weeds as well as in all plants. Due to this phenomenon, we needed accuracy to minimize the uncertainties. In order to estimate the plant’s density by counting the plants and accurate precision, optimal sampling method is developed. Crop density was the basic agronomical trait, which is used to manage the wheat crops and its yield. Plant’s visual counting within field is the most common method, which is in use. But it was a time consuming and tedious method. The basic purpose of this work was to develop a visual machine-based method in order to automate the density survey of wheat at its early stage. RBG images can be obtained by using high resolution camera in order to identify the green pixels of the plants. Rows of crop can be extracted, and its connected components can be identified by this method. After this, a neutral network trained in order to estimate the total plants in the features of the object.
Mutanga et al. [10] proposed that in the past few papers, density of plants and their non-uniformity was used to derive the competition within different plants along with their weeds. There was a need of their estimation with little accuracy. Optimal sampling method was usually used to estimate the density of plants in wheat crop from counting towards precision. For producing maximum amount of capacity for combined harvesting, a constant need of biomass was important within threshing systems, which was needed to be maintained.
Bendig et al. [11] described the problem of saturation was faced using the NDVI for different biomasses estimated to be in high canopy density vegetation. It was a well know phenomenon. Different techniques of spectroscopy were used for narrower band vegetation indices, which were computed from red edge. The NIR shoulder can be improved for the estimation of amount of biomass in such kind of situations.
Shi et al. [12] described that the variability within-row spacing and location of corn plant had been verified to have an important correlation with biomass and grain yield. They had included various models for yield prediction which were used in order to guide applications of variable-rate fertilizer within mid-season. Prototype sensing system has been developed in order to measure spacing and corn plant location on-the-go based on LiDAR technology on ground. The system moved along rows of crop with a sensor of ground LiDAR scanning at the lower bottom section of every corn plant. The probability of identification of corn stalk was enhanced because every stalk appeared in different scans from various types of view angles of that sensor. The firstly version of prototyping system had been developed at early stages and resulted towards lower detecting accuracy. Within paper, a better version of the prototyping system was developed with evaluation results of considerable additional field. This system had been improved within term of the data processing algorithm and data acquisition platforms, specially, the stalk recognition and scanned registration procedures in order to reduce the errors in misidentification.
Liu et al. [13] describe that crop density was main agronomical trait, which was used in order to manage the wheat crops with estimated yield. Visual-counting of various plants within field was presently the commonly used method. But it was time consuming and tedious. The main purpose of the work was the development of the machine vision-based method in order to mechanize the density-survey of plants of wheat at their early stages. RGB images, which have taken by RGB camera of high resolution were classified in order to recognize the green pixels conforming to the plants. Crop Rows of crops were extracted and their connected components were identified. After that, neural network was trained in order to estimate the total numbers of plants in the components by using features of the object. The method was appraised over total three experiments viewing contrasted conditions having sowing densities between the range of 100 to 600 seeds per square meter.
Lin et al. [14] described that the recent decades, different techniques regarding sensors had used for estimation of crop density. They had been divided into two categories based upon measurement of used principle i.e. non-contact sensors and contact sensors. Contact sensor was used to measure the deviation of that component of sensor, which was movable by virtue of its link with the crops. The frequency and amplitude of deviation was registered and to be used for measurement of crop density.
Thapa et al. [6] proposed that the most recent and fast development for computer vision algorithms and sensors gives different opportunities needed to be estimated plant density by using non-intrusive methods. Mostly studies on estimation of plants density were using non-contact measurements of ground level, mainly focused on large size plants like maize that can be regularly spaced. Mostly techniques used were based on identification of plants by using LiDAR systems and RGB images.
Zheng et al. [15] proposed in this paper another crop was taken which was rice from whole population approximately half world feeding this crop. From this situation we were able to say that in food security rice production plays a vital role. In this situation it’s very necessary or important to protect or care crops. In this paper new or different improve methods of UAV was introduced or applied.
Abu Bakar et al. [16] proposed that population density of rice plant was a basic indicator in order to determine the rate of fertilizer application and crop setting. It was therefore important that the density of population was monitored in order to ensure that an appropriate crop management decision was taken. The conventional method in order to determine population of plant was by physically counting the whole number of rice plants tillers within frame of 25 cm x 25 cm square. Sampling was done by arbitrarily choosing various locations in a plot to achieve tiller counting. This sampling process was costly, labour intensive and time consuming. An alternate fast estimating process was developed in order to overcome this type of issue. This process relies on calculating the ambit or outer circumference of the confined rice plants in a frame of 25 cm x 25 cm square in order to determine the exact number of tillers within square frame.
MATERIALS AND METHODS
In previous papers we have read many techniques which differ in level or in sense of accuracy. As these techniques or methods are discussed in previous papers. Some techniques do not provide accurate results. Crop image capturing was very difficult many issues were faced like: unmanned aerial vehicle altitude, lightning issues, land flatness issues etc. Except some methods all algorithms were not relay on digital image processing. Some researchers face core challenges in crop density estimation. But this research paper provides extensive methods or algorithm to calculate the number of plans in image. Firstly, we read image information, then find the image information by using Matlab2019a. Secondly, we convert an image in multicolor image by using MATLAB 2019a. Next by using color thresholder separate the image from background assign values 0’s or 1’s. Also equalize the brightness of an image. Finally, we calculate the number of plant density in image.
Unmanned Aerial Vehicles (UAV) were most resent used sensor device that efficiently capture the high-resolution image like a human eye capture also provide the accurate results for further processing. In precision agriculture unmanned aerial vehicles has widely used it’s a cost effective and provide accurate results. Now a day’s many versions are available with more accurate sensor camera, hardware and GPS systems. We simply say that every walk of life it’s use is very simple or efficient. Beneficial for both researcher and farmer in any field also for precision agriculture. Widely used in precision agriculture focused on recent modern technology-based methods such as UAV and photogrammetric.
Study Area
The study area that I selected has different density/height of crops. In some places, the density of crop was varying. While we selected any field in order to calculate the density, one thing must be kept in mind that, every selected area has different crop density. One field has high density while others have low density. My study site was situated at University of Agriculture. In Agriculture University Faisalabad, many areas of greenery are present. The field that I took was also situated at university.
Input Images
Step by step procedure as follows:
- In this paper some images were captured by using drone DJI Phantom 4
- Drones which I used in this research fly at low altitude by covering large area of field and also captured quality images, while others UAV fly at high altitude in this situation by compromising on image quality
- Images were captured at different altitude
- 2-Dimentional images were captured
- As I discussed in the start that unmanned aerial vehicles are used where human access is not possible. They are also very cost effective. So, by using UAV, labor cost and time has decreased and we can observe the crop more accurately
- DJI has used as unmanned aerial vehicle for this research. It’s an automated or modern equipment for this platform because no proper scientific coding or background is needed in this platform. These remote sensing devices are mostly used by farmers or researchers’ now’s a day due to their reasonable cost. It is a cheapest platform in order to capture the accurate or clear images for higher resolution (Figure 1).
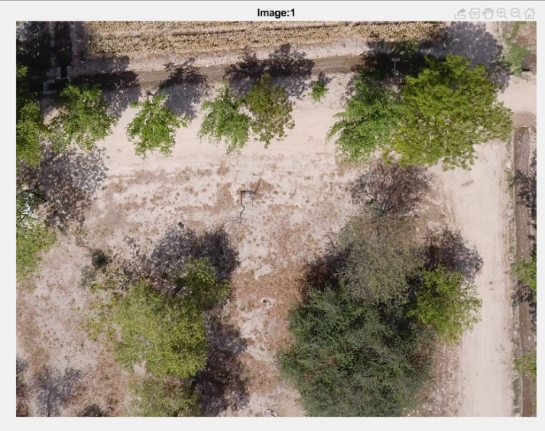
Figure 1: Input Image captured by using drone DJI Phantom 4
Image Conversion
- By using MATLAB R2019a, functions applycform and makecform, I converted an image. By applying these functions green portion of plant was highlighted. So, I can easily locate the exact positions of the plants.
After getting the multi-Color image, I equalized the brightness of an image which helps me in order to identify thresh holding (image is separated from background) values of an image. So, it can be seen from the image that presence of plants is represented by the dark portion and background was appeared gray. So, on can easily investigate the exact location of plants with the help of this technique.
By applying gray thresh function, multidimensional array was changed into 2-D array and reshaped the image by ignoring nonzero imaginary values of an image. I assigned 1 value to the target area/black area and 0 value is assigned to the background area/white area. So, by assigning these values, image has become separated from the background.
Estimate density (Number of plants) I used Bwareaopen function which removed small objects by applying limit.
For example, I took 300 values which removed the small objects less than 300 pixels. Then, I found the connected components in an image by using bwareaopen function. Connected components means that how much area was covered by a single plant. Finally, I found the density of an image.
RESULTS AND DISCUSSIONS
After proper processing i obtained following results. Original image rotate at angle of 45 degree. Then converted into gray scale and lastly obtain the histogram of the given image (Figure 2).
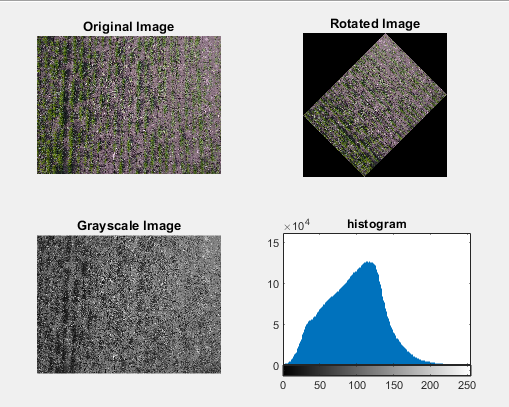
Figure 2: Original Image Conversion into Histogram
Now same process is done with image taking through drone in order to find the output that how many objects or number of plants were present there. Following are the output images which shows how to calculate the number of plants. Following images have taken by the use of phantom 4 DJI drone. I converted the image into multi-colored image in the first step and then equalized the brightness of colored image. In the third step, I applied threshold method on that image. In the last step, found number of plants from the image (Figure 3).
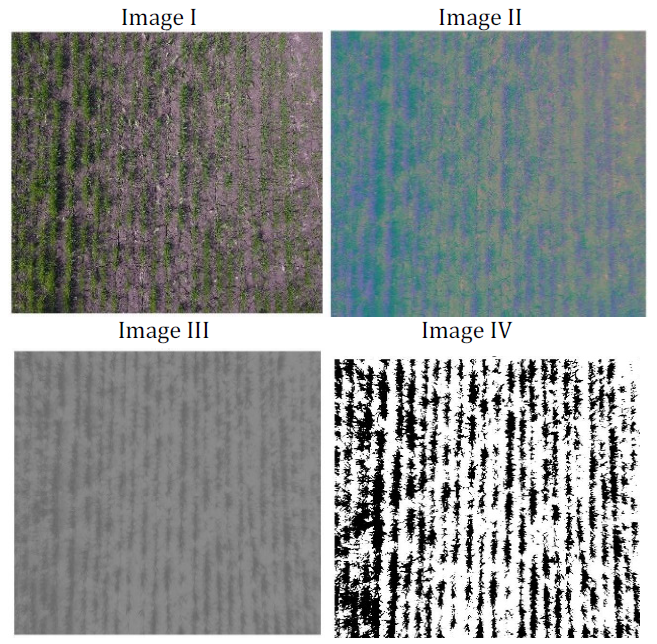
Figure 3: Final Output Image Which shows Plants Density
Appeared the MATLAB command window which shows the number of plants present in a specific area (Figure 4).
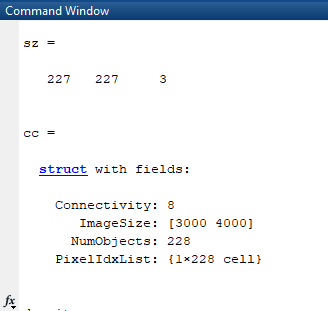
Figure 4: Shows Calculated Density
CONCLUSIONS
In this thesis, I studied modern technological methods in the field of agriculture instead of using conventional means. Agriculture is playing a crucial part in economy of our country. I had used such modern methods in this research work, due to which, the cost will remain minimum and product was become maximum. As we know, population of our country is increasing immensely and consumption of food also become higher. The main purpose of my research work is to count the number of plants within selected field. Number of plants are considered as the density of plants. If density of plants is higher, then, it means, health of crop in that field is good. So, in order to identify the crop density, I used modern techniques within fields. Old conventional methods were time consuming and it has become difficult for us to use those methods in order to find out the density. Manual counting of plants is difficult method, so, by using the modern technology, it becomes easier for farmers to count exact number of plants.
These included the flexibility in order to acquire aerial imagery by using any of wider variety of the digital camera or any of wider variability of manned aircraft platforms and unmanned aerial vehicles (UAV), and not were depend on more exclusive and less accessible manned aircraft ALS or UAV sensors and platforms. As a result, this leads towards more flexible range of timings of deployment (enhanced temporal resolution for acquisition of data) and lowered deployment cost when matched with ALS method. I took different aerial pictures of crop and then applied various methods in order to obtain values of crop density. I used global control points in order to capture images of crop with the help of drones. Then, I applied best algorithms in order to find out the best and accurate results. With the help of unmanned aerial vehicles (UAV), I studied the aerial images and used these images for the further calculations/measurements. I used MATLAB software which is considered best for image processing and deep learning. By using CNN (Convolutional Neural Network) algorithms, which is a technique of MATLAB, the density of crop is find out.
In 21st century we face some major challenges like crop health, disease threads, soil productivity and food production. After the advance studying the knowledge that we get from this study science is apply to solve these global available challenges. Being a part of this environment to see that that we use method for healthy crop is suitable for next generation come in the agricultural world. We should try to use the latest technologies or techniques to improve plant health, growth, production or crop management. As agriculture is a very vast or fast cycle of processing. Agriculture is a very fast lifecycle. Which start from human, animal and environment. Agriculture field used new technologies with combination of other field like computer science to increase the crop production or yield. This agriculture field also produce the raw material or waste material for further we use it for producing other products. Many people are related this field as employment. For many people of any country causes source of income. In the computer science field, there are many new methods or techniques are available to improve the crop health is remote sensing technique or precision agriculture. To get all related information about crop it is very necessary.
I took various images from the surface of field. Every part of the field has different crop density. So, I applied different techniques on every patch of the field to find out the difference of density on all those parts of the field. After doing all this task, I compared the finally obtained result with actual numbers of plants present in the field. Then, I found that all my results are matched with the actual numbers of plants present within field.
So, it resulted that all the modern methods which I have used in order to find out the density are accurate and very efficient in order to calculate the crop density as compared to previously used conventional and formal methods. So, the main purpose of my study was become enable in order to replace the old methods with the new ones in order save time and cost effect. So, we become enable to calculate the crop density in short time period. If crop density is higher in a specific area, then, it means crop is heathier in that area. So, crop density is very helpful too in order to estimate the health of the crop. So, it could be helpful for the farmers, that, he can estimate the exact area for the crop, in which, it grows well.
REFERENCES
- Jin, X. et al. “Estimates of plant density of wheat crops at emergence from very low altitude uav imagery.” Remote Sensing of Environment, vol. 198, 2017, pp. 105–114.
- Drisya, J. et al. “Spatiotemporal variability of soil moisture and drought estimation using a distributed hydrological model.” Integrating Disaster Science and Management, 2018, pp. 451–460.
- Orillo, J.W. et al. “Determination of green leaves density using normalized difference vegetation index via image processing of in-field drone-captured image.” Journal of Telecommunication, Electronic and Computer Engineering, vol. 9, no. 2–6, 2017, pp. 1–5.
- Yang, G. et al. “Unmanned aerial vehicle remote sensing for field-based crop phenotyping: Current status and perspectives.” Frontiers in Plant Science, vol. 8, 2017, pp. 34–45.
- Mahesh, B. et al. “Endophytic mycoflora of inner bark of azadirachta indica A. Juss.” Current Science, vol. 88, no. 2, 2005, pp. 218–219.
- Thapa, G.J. et al. “Counting crocodiles from the sky: monitoring the critically endangered gharial (gavialis gangeticus) population with an unmanned aerial vehicle (UAV).” Journal of Unmanned Vehicle Systems, vol. 6, no. 2, 2018, pp. 71–82.
- Moritz, R.F. et al. “Determining colony densities in wild honeybee populations (apis mellifera) with linked microsatellite DNA markers.” Journal of Insect Conservation, vol. 12, no. 5, 2008, pp. 455–459.
- Saeys, W. et al. “Estimation of the crop density of small grains using LiDAR sensors.” Biosystems Engineering, vol. 102, no. 1, 2009, pp. 22–30.
- Parker, J.R. Algorithm for Image Processing and Computer Vision. 2nd ed., Wiley Publishing, 2011.
- Mutanga, O. et al. “High density biomass estimation for wetland vegetation using worldview-2 imagery and random forest regression algorithm.” International Journal of Applied Earth Observation and Geoinformation, vol. 18, 2012, pp. 399–406.
- Bendig, J. et al. “Estimating biomass of barley using crop surface models (CSMs) derived from UAV-based RGB imaging.” Remote Sensing, vol. 6, no. 11, 2014, pp. 10395–10412.
- Shi, Y. et al. “Improvement of a ground-LiDAR-based corn plant population and spacing measurement system.” Computers and Electronics in Agriculture, vol. 112, 2015, pp. 92–101.
- Liu, S. et al. “A method to estimate plant density and plant spacing heterogeneity: Application to wheat crops.” Plant Methods, vol. 13, no. 1, 2017, pp. 38–40.
- Lin, C. et al. “Detecting newly grown tree leaves from unmanned-aerial-vehicle images using hyperspectral target detection techniques.” ISPRS Journal of Photogrammetry and Remote Sensing, vol. 142, 2018, pp. 174–189.
- Zheng, H. et al. “Improved estimation of rice aboveground biomass combining textural and spectral analysis of uav imagery.” Precision Agriculture, 2018, pp. 71–82.
- Abu Bakar, B. et al. “Ambit determination method in estimating rice plant population density.” International Journal of Food Research, vol. 2, no. 2, 2018, pp. 177–182.